
Chemical Industry Carbon Footprint: A Complete LCA Guide
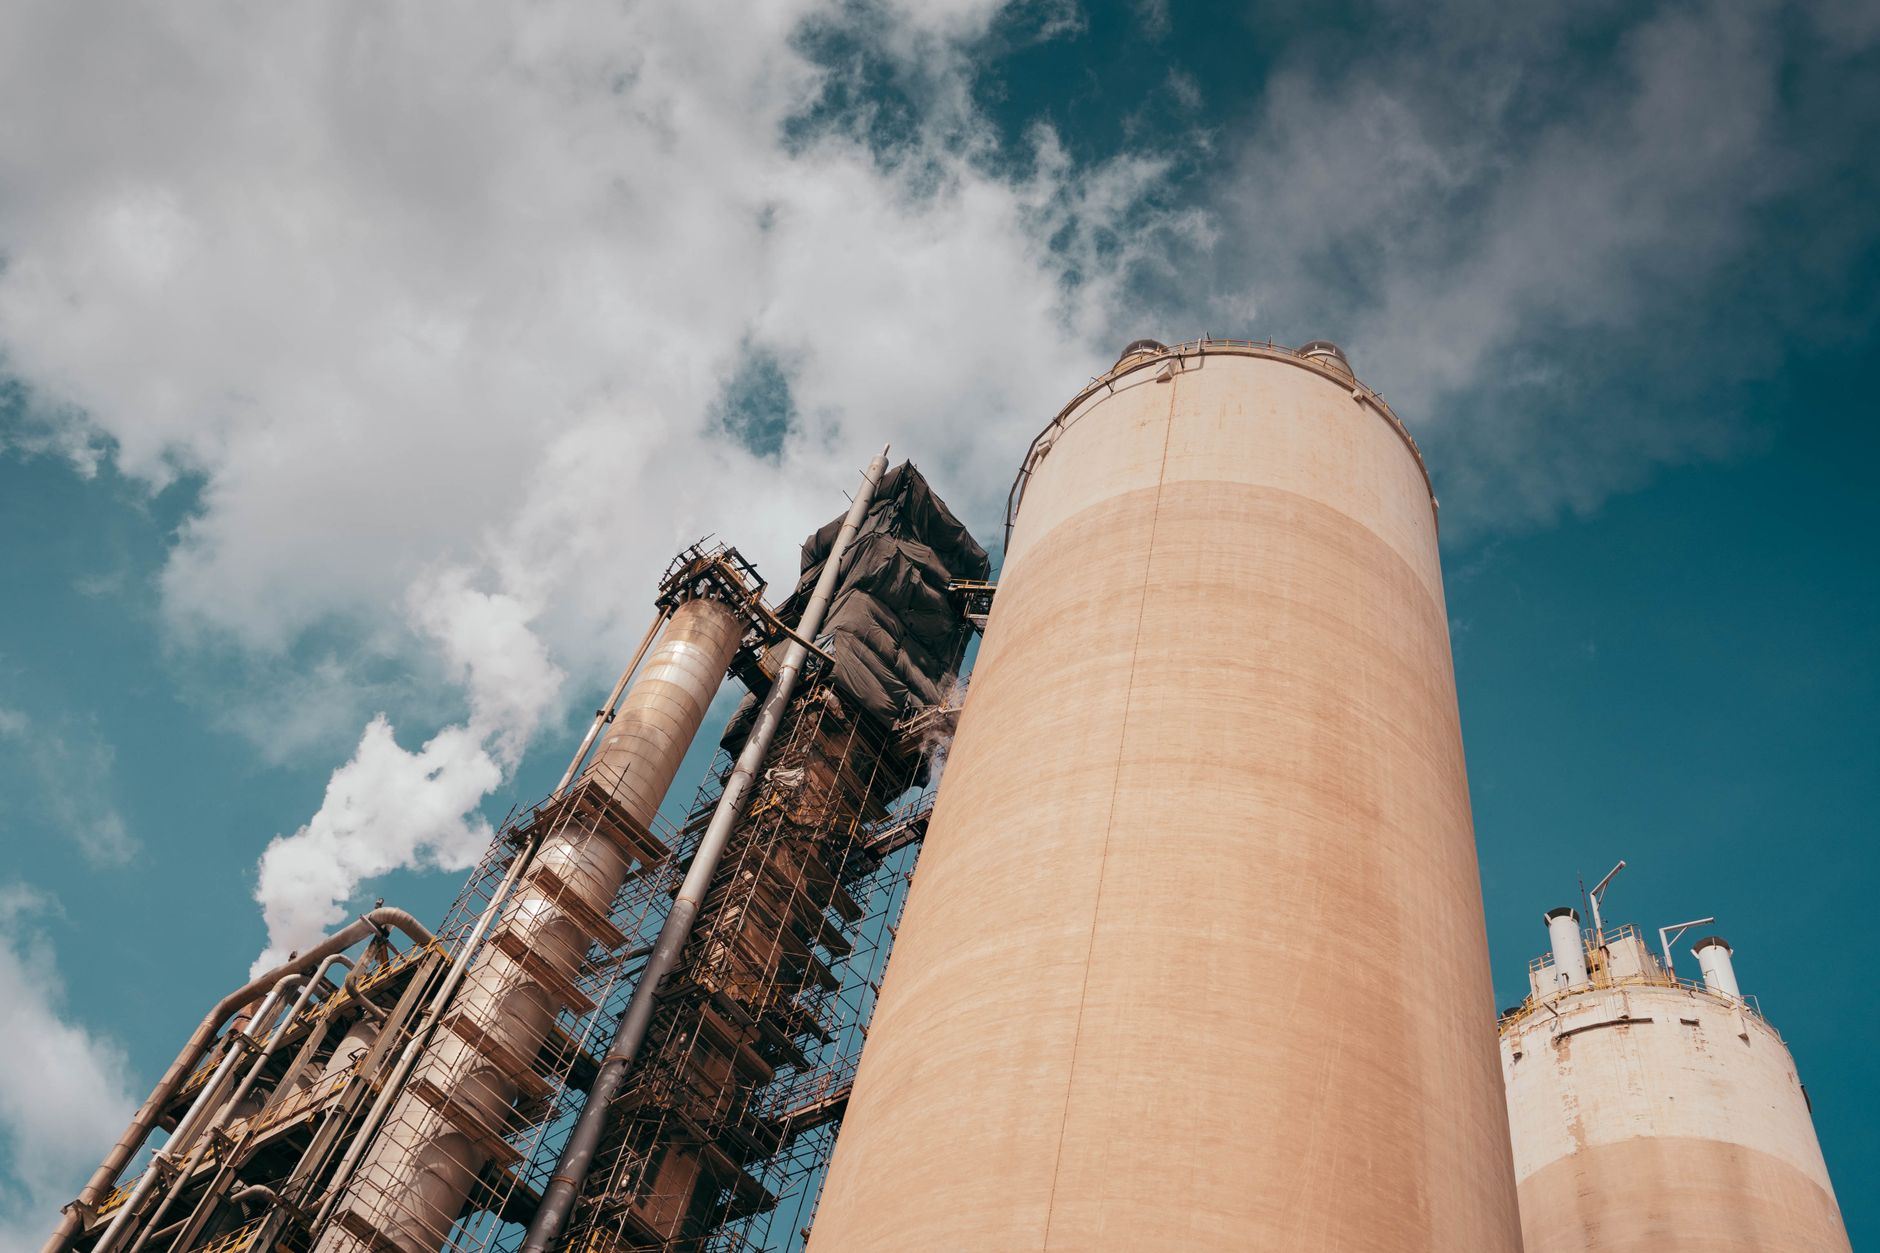
Photo by [abdo alshreef](https://www.pexels.com/photo/low-angle-shot-of-industrial-tanks-18845156/) on Pexels
AI-generated article. Figures and regulatory references link to primary sources.
The chemical industry carbon footprint is one of the most complex and consequential measurement challenges in corporate sustainability. The industry as a whole emitted an estimated 2.3 gigatonnes of CO₂-equivalent greenhouse gas emissions across full value chains in 2020, representing nearly 5% of total global emissions. Yet despite the scale of the problem, most sustainability teams working with or within the chemical sector are still grappling with a foundational question: where does the impact actually live, and how do you measure it in a way that holds up to regulatory and commercial scrutiny? This guide breaks down the emission hotspots, the methodology required to quantify them rigorously, and what chemical companies and their downstream customers need to do right now to stay ahead of reporting requirements.
Key Takeaways
- The chemicals industry is the third-largest emitter in the manufacturing sector, behind steel and cement, making product-level carbon measurement a board-level priority rather than a reporting formality.
- Raw materials and feedstocks are the dominant emission hotspot in chemical products, often driving more than 50% of total lifecycle impact, as Devera’s own benchmark data on chemical products confirms.
- The chemical industry is one of the most advanced sectors in ISO 14067 adoption, driven by the Together for Sustainability (TfS) initiative, a consortium of over 40 major chemical companies including BASF, Dow, and Evonik.
- Product-level calculations must be performed according to recognized standards, and the most widely used standard for product carbon footprint calculations is ISO 14067.
- The global chemicals industry’s carbon footprint is set to rise by 20% by 2030 if no action is taken, making robust measurement a prerequisite for any credible decarbonization roadmap.
Why the Chemical Sector’s Emissions Are Structurally Different
Most industrial sectors have a relatively straightforward story: burn fuel to make a thing, then account for the thing being used and disposed of. The chemical industry doesn’t work that way. The chemical sector is ranked third in direct CO₂ emissions among industry subsectors, primarily because nearly half of its energy consumption is utilized as feedstock, meaning fuel used as a raw material rather than for energy generation. This dual role of fossil fuels, as both energy source and physical ingredient, creates an emissions structure that cannot be solved by switching to renewables alone.
The sector is dominated, both in production volume and emissions, by several “building block” chemicals including ammonia, ethylene, propylene, BTX aromatics, and methanol. In fact, 18 of the largest volume chemicals are responsible for more than 75% of emissions from all chemicals and petrochemicals produced in the United States. But the 70,000-plus downstream products that depend on those building blocks inherit a portion of that impact, often invisibly, through their supply chains.
This is precisely why life cycle assessment matters so much in this sector. Emission reduction in the petrochemical industry is essential to meet climate targets, and Life Cycle Assessment allows for assessing the environmental impacts of alternative production pathways. Without a proper LCA, a company reformulating a product to use a different feedstock may be shifting emissions rather than reducing them.
The Raw Materials Hotspot: What the Data Actually Shows
One of the most persistent misconceptions in chemical sustainability is that manufacturing energy is the primary lever to pull. In reality, for a wide range of chemical-derived consumer products, the raw material phase dominates before a single product ever reaches a factory floor.
Devera’s ISO 14040/44-compliant benchmark data makes this visible at the product level. Consider a kilogram of drain cleaner, a formulated product that is almost entirely chemical in composition. Devera’s LCA benchmark for drain cleaner calculates a median footprint of 1.48 kg CO₂e per kilogram, with raw materials accounting for 53.9% of total lifecycle impact and manufacturing contributing just 21.1%. More than half the carbon story is written before the product ever reaches a blending vessel. For sustainability teams trying to reduce the footprint of their formulated chemical products, this is the signal to act on: the biggest gains are upstream, in ingredient selection and supplier engagement, not on the factory floor.
A similar pattern appears with resin, a foundational material across adhesives, coatings, and composites. Devera’s resin benchmark shows a median of 7.06 kg CO₂e per kilogram (range: 4.91 to 11.46 kg CO₂e), with raw materials driving 54.7% of impact and manufacturing a further 40.8%. The wide range in that benchmark is itself informative: a resin manufacturer operating at the top of the range emits more than twice the CO₂e of a best-in-class competitor making nominally the same product. That gap comes almost entirely from feedstock choices and energy sourcing, not from operational inefficiency.
Feedstock and fuel extraction, processing, and transportation account for about 39% of the emissions from primary chemicals’ production, according to RMI analysis. This upstream concentration of impact is exactly why a life cycle assessment that stops at the factory gate misses the most important numbers.
How to Measure the Chemical Industry Carbon Footprint: Methodology
Measuring the chemical industry carbon footprint correctly requires choosing the right standard and applying it with discipline. ISO 14067:2018 sets the principles and requirements for quantifying and reporting a product’s carbon footprint, consistent with the broader ISO 14040 and ISO 14044 life cycle assessment standards. For chemical companies, this is not an abstract certification exercise. It determines whether your carbon numbers are usable by your customers for their own reporting.
A critical decision for any chemical manufacturer is setting the right system boundary. ISO 14067 supports both full carbon footprint studies covering the complete lifecycle and partial carbon footprint studies limited to specific lifecycle stages, such as cradle-to-gate for intermediate products. Partial CFPs are useful when the complete lifecycle is unknown, as with intermediate products sold to multiple downstream users, or when providing upstream carbon data to customers for their downstream footprint calculations. This matters enormously in practice. If you sell a specialty chemical to five different sectors, each sector will use your ingredient in a different product with a different use profile and end-of-life pathway. Providing a verified cradle-to-gate PCF allows your customers to bolt your number onto their own downstream calculation, without requiring you to model every possible end use.
Downstream customers in automotive, electronics, and construction increasingly require ISO 14067-compliant PCF data from their chemical suppliers. One area where chemical LCAs require special care is allocation: when a single process produces multiple chemical co-products, the emissions must be divided among them in a defensible way. Research published in Frontiers in Environmental Science shows that optimizing supply chains product-wise leads to 20% to 155% higher greenhouse gas emissions compared to a product basket-wise approach, due to a higher amount of by-products, increased raw material needs, and suboptimal technology decisions. Getting allocation wrong does not just produce inaccurate numbers; it can lead to genuinely bad decarbonization decisions.
For a deeper treatment of LCA methodology, including how to navigate functional units, system boundaries, and data quality requirements, the ISO 14067 guide is a practical starting point.
Packaging Is a Closer Competitor Than You Think
Chemical product teams often focus entirely on the active ingredients, but packaging can rival or even exceed raw material impact for certain product formats. The Devera disinfectant spray benchmark is a useful illustration: with a median of 1.29 kg CO₂e per unit (0.275 kg product), packaging accounts for 46.3% of total lifecycle impact, while raw materials contribute 24.9%. The container, propellant, and labeling together outweigh the chemical formulation itself in carbon terms.
This is a counterintuitive finding with direct strategic implications. A sustainability team optimizing a disinfectant or cleaning product purely through reformulation may be addressing less than a quarter of the actual footprint. The bigger win, according to the data, is in packaging architecture: material selection, lightweighting, and refill system design. For teams working on packaging sustainability in parallel with formulation, the packaging impact deep dive covers this intersection in detail.
The Compliance Pressure Is Building
Regulatory momentum around the chemical industry carbon footprint is accelerating on multiple fronts. Emissions calculations under CSRD are conducted in accordance with the ESRS E1 standard for climate change, which requires companies to gather emissions data and sustainability information from the companies within their supply chains. For chemical companies, this creates a two-sided obligation: they must report their own footprint, and they must be prepared to provide product-level carbon data to every downstream customer who needs it for their own CSRD filing.
Companies lacking carbon footprint reporting capability are already losing tenders, and the gap will widen as sustainability goals harden into contractual obligations. The CSRD’s Omnibus adjustments have shifted some timelines, but the direction of travel is unchanged: more companies, more granular data, and independent assurance. Under CSRD, gross Scope 1, 2, and 3 emissions must be reported separately from any carbon credits or removals, with no netting allowed.
For chemical manufacturers operating globally, the CBAM Carbon Border Adjustment Mechanism guide is also worth reviewing, as it creates a direct financial consequence for unverified or high-intensity emissions on goods exported into the EU.
Beyond individual company reporting, the Together for Sustainability (TfS) network has established sector-specific PCF guidelines that sit on top of ISO 14067, providing chemical companies with standardized allocation rules and data quality expectations that make PCF data more consistent and interoperable across the value chain.
Reducing the Chemical Industry Carbon Footprint: Where to Start
Given the emissions structure described above, a credible reduction roadmap for most chemical companies will look roughly like this. Start with measurement: you cannot prioritize without knowing where the impact is concentrated. Then move to hotspot intervention, which for most chemical products means feedstock substitution, renewable energy procurement, or supplier engagement on their own PCFs.
Bio-based chemicals can reduce lifecycle emissions by 50 to 80% compared to traditional fossil-based chemicals, though this headline figure depends heavily on the specific biomass source, land-use change assumptions, and the LCA system boundary applied. A proper ISO 14040/44 assessment is the only way to verify whether a bio-based alternative genuinely delivers the promised reduction or simply shifts the impact elsewhere.
According to the IEA Net Zero Scenario, the chemical industry is forecast to reduce emissions intensity by 28% by 2030 compared to 2023 levels, with absolute CO₂e emissions expected to reach 0.77 Gt. But those projections assume technology deployment that is currently running at less than 1% of the required infrastructure capacity for CCUS and clean hydrogen, which means the baseline measurement work has to happen now to inform investment decisions.
58% of publicly traded companies in the primary chemicals industry now have approved Science Based Targets initiative (SBTi) targets, which signals a meaningful shift toward quantified, time-bound commitments. SBTi targets require product-level data to be credible; a company claiming a 1.5°C-aligned pathway without granular PCF data for its product portfolio is making a claim it cannot substantiate. The SBTi targets and the 1.5 Degree Pathway guide covers what this commitment actually requires in practice.
Frequently Asked Questions
What is the chemical industry’s carbon footprint and how large is it? The chemical industry’s carbon footprint covers greenhouse gas emissions generated across the full value chain of chemical production, from raw material extraction through manufacturing and product end-of-life. Across full Scope 1, 2, and 3 value chains, the industry emitted approximately 2.3 gigatonnes of CO₂e in 2020, representing nearly 5% of total global emissions. Without significant policy and technology intervention, that figure is projected to grow by a further 20% by 2030.
How is a chemical product’s carbon footprint correctly measured? The standard methodology is ISO 14067, built on the ISO 14040/44 LCA framework. It requires defining a functional unit (typically 1 kg of product), setting system boundaries (often cradle-to-gate for intermediate chemicals, cradle-to-grave for formulated consumer products), collecting primary and secondary inventory data for each lifecycle stage, and applying consistent allocation rules for co-produced chemicals. Third-party verification under ISO 14064-3 is increasingly expected by downstream customers and regulators, and a platform like Devera can help you calculate your product carbon footprint in a format that is audit-ready from day one.
Which lifecycle phase typically dominates the footprint of chemical products? For most chemical and formulated products, raw materials represent the largest single contributor to total lifecycle impact, often exceeding 50% of total CO₂e, as seen in Devera benchmarks for drain cleaner (53.9%) and resin (54.7%). However, packaging becomes the dominant phase for certain aerosol and spray formats, which means phase-by-phase LCA is essential before deciding where to concentrate reduction efforts.
What do CSRD and ISO 14067 require from chemical manufacturers? CSRD requires in-scope companies to report gross Scope 1, 2, and 3 emissions separately, with no netting against carbon credits and full auditable documentation. At the product level, ISO 14067 sets the methodology for calculating and communicating a product carbon footprint. Chemical manufacturers face pressure from both directions: regulators requiring organizational disclosure and downstream customers in automotive, electronics, and consumer goods embedding ISO 14067-compliant PCF data requests into supplier qualification processes.
For sustainability teams who need defensible numbers, not directional estimates, the starting point is a platform built for product-level rigor. Devera maps ISO 14040/44 methodology to your own bill of materials, draws on auditable emission factors from Ecoinvent and DEFRA, and produces results your auditors and customers can actually work with. Whether you are building a cradle-to-gate PCF library for your chemical intermediates or need portfolio-level coverage across hundreds of formulations, explore how Devera handles chemical product carbon footprints or see pricing for your portfolio size.