
Furniture Carbon Footprint Reduction: Where to Start
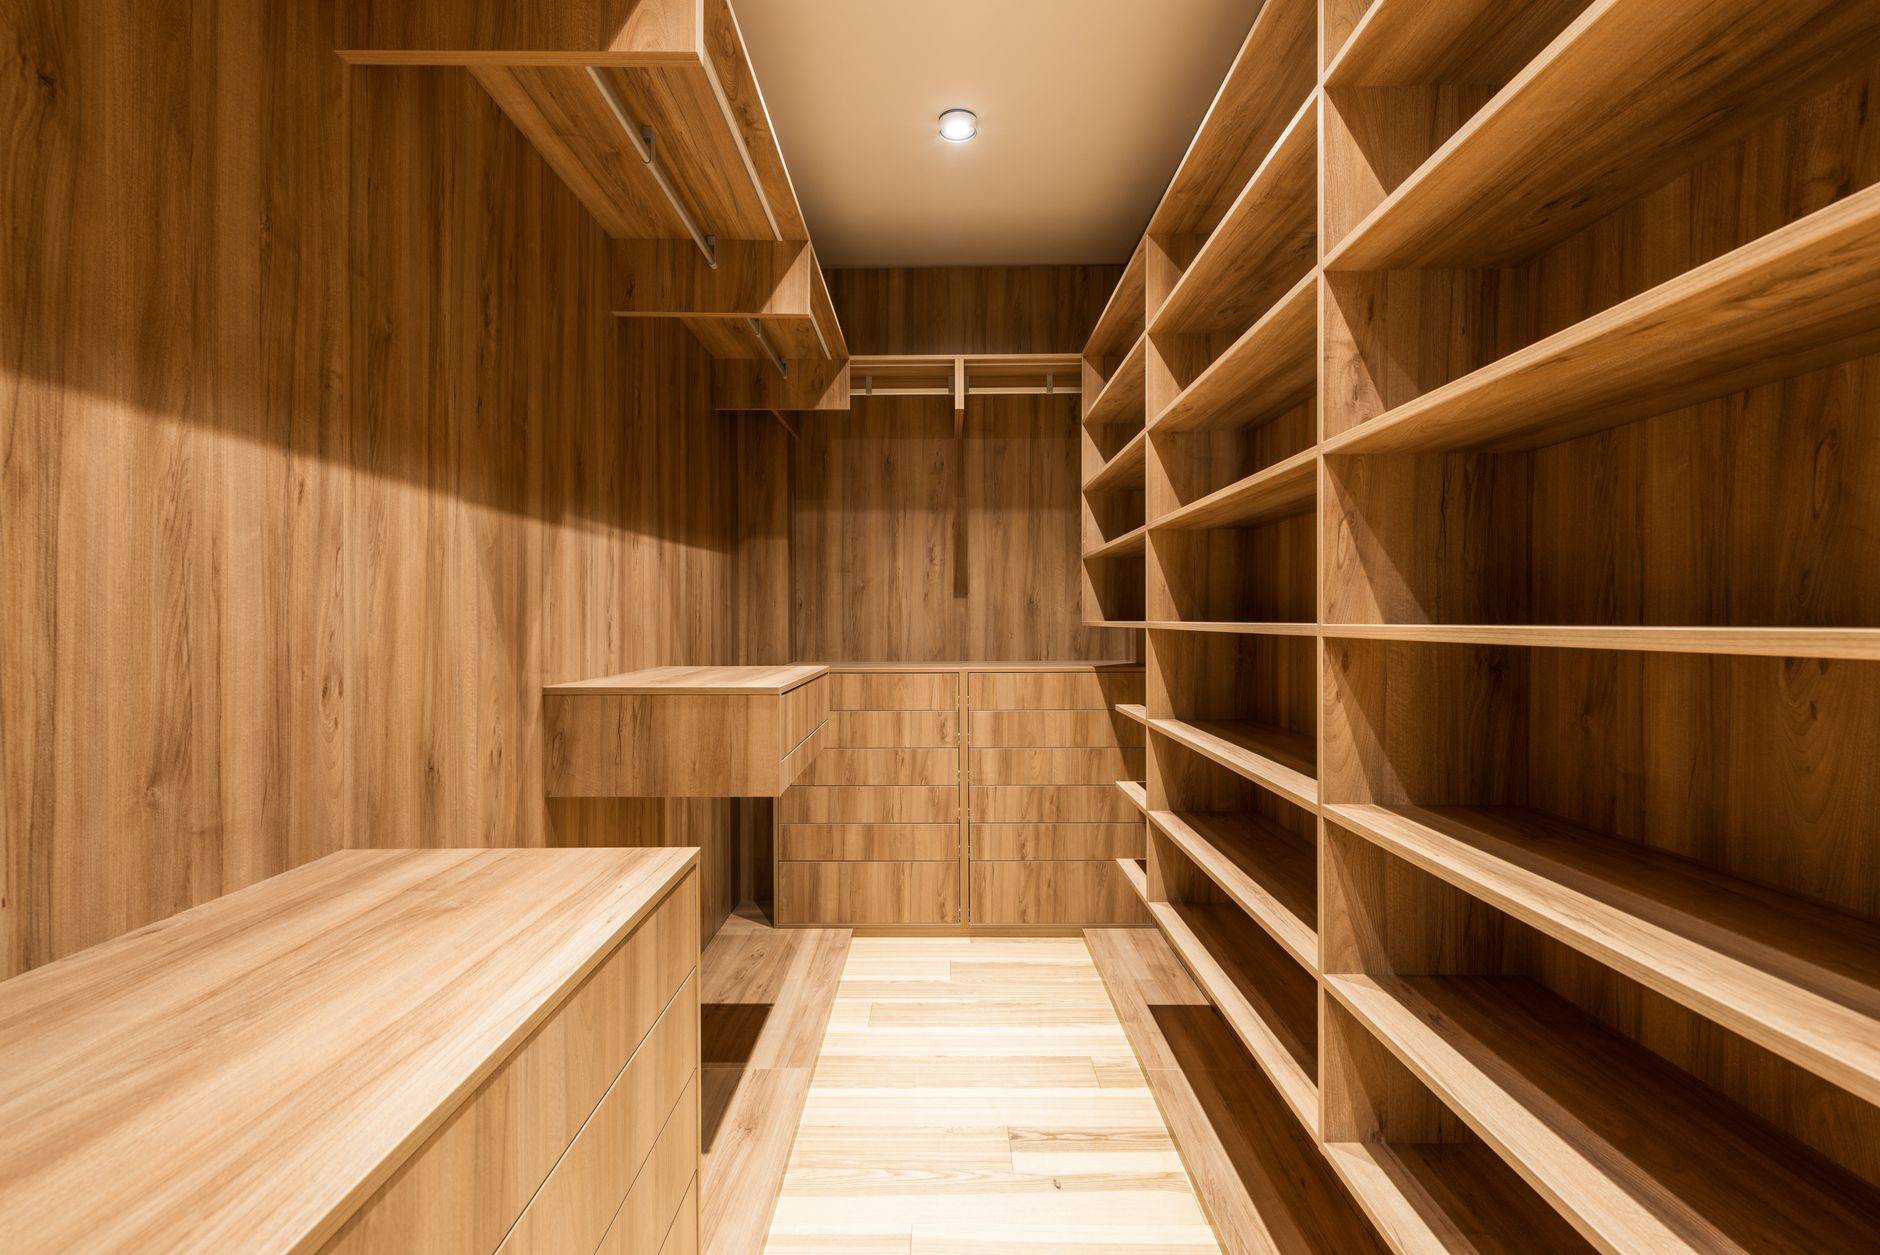
Photo by [Max Vakhtbovych](https://www.pexels.com/photo/modern-wardrobe-interior-with-shelves-at-home-7045314/) on Pexels
AI-generated article. Figures and regulatory references link to primary sources.
Furniture carbon footprint reduction begins with one uncomfortable fact: the biggest emissions are locked in before a piece ever leaves the factory. In Devera’s LCA benchmarks, raw materials account for 52.7% of a stool’s footprint and 39.9% of a wardrobe’s, and a single stool can range from 8.34 to 44.83 kg CO₂e depending on how it is made. This guide shows where furniture emissions come from, which levers move the number most, and how to prove the reductions with data rather than claims.
Key Takeaways
- Materials and manufacturing dominate furniture footprints, so design and sourcing decisions beat logistics tweaks for most products.
- Two stools can differ by a factor of more than five. The gap comes from material choice, process energy and construction, not from product size alone.
- End of life is a real lever for bulky furniture, because durability, repairability and reuse change how many units must be produced.
- Wood is not automatically low carbon. Its advantage depends on sourcing, adhesives and finishes, and on how biogenic carbon is accounted for.
- Furniture is a priority product group under the EU’s ecodesign rules, so product-level data will soon be expected, not optional.
Where Furniture Emissions Actually Come From
It is tempting to start a furniture decarbonization plan with trucks and warehouses. The data points elsewhere. Devera’s stool benchmark has a median of 21.57 kg CO₂e per stool, with raw materials at 52.7%, manufacturing at 24.6% and end of life at 13.6%. Transport does not even appear among the three largest phases. In other words, roughly three quarters of the footprint is decided by what the stool is made of and how it is built.
The wardrobe benchmark tells a similar story at larger scale. The median is 159.41 kg CO₂e per unit, with raw materials at 39.9%, manufacturing at 26.8% and end of life at 22.0%. The end of life share is the surprise. For a large, heavy product made of panels, hardware and coatings, what happens after the customer is finished with it carries nearly a quarter of the footprint.
If you are new to this kind of breakdown, our guide on hotspot analysis in LCA explains how to find the phases worth attacking first.
Why Two Similar Products Can Differ by 5x
The most useful number in the stool data is not the median. It is the range. The benchmark spans 8.34 to 44.83 kg CO₂e, and the score thresholds make the gap concrete: a stool needs to come in under 12.11 kg CO₂e to earn an A, while the median sits in the C band (under 24.81). The wardrobe shows the same pattern, with a range of 67.61 to 263.58 kg CO₂e and an A threshold of under 97.6 kg CO₂e against a median of 159.41.
That spread is good news. It means furniture carbon footprint reduction does not require inventing new technology. It requires moving a typical product toward the best-performing end of what already exists. The levers below explain how.
Lever 1: Choose Lower-Impact Materials
Because raw materials are the largest phase, this is where most of the reduction sits. Three material decisions matter most.
Recycled and Lower-Carbon Metals and Panels
Primary steel and aluminium are energy intensive, so recycled content in frames, legs and fittings can cut embodied emissions noticeably. For panel furniture, the binder system and the share of recycled wood fibre influence the result as much as the wood itself. Ask suppliers for product-specific data, not generic averages.
Wood, Done Honestly
Wood can be a strong ally. Research reviewed in BioResources notes that the carbon stored in solid wood furniture can be treated as a negative value in life cycle accounting. The catch is that this storage is temporary. If the piece is burned or decays in a landfill at end of life, the carbon returns to the atmosphere. Credible claims therefore depend on responsible forestry, a long service life and a clear accounting rule, which is exactly why transparent methodology matters.
Adhesives, Foams and Finishes
Small-mass components can punch above their weight. Resins, foams and coatings often have much higher emissions per kilogram than timber. Devera’s resin benchmark shows a median of 7.06 kg CO₂e per kilogram, with raw materials at 54.7% and manufacturing at 40.8%. That is many times the per-kilogram footprint of typical wood or brick. Minimizing resin content, or switching to mechanical joints, can pay off even when the weight saved looks trivial.
Lever 2: Cut Manufacturing Energy and Waste
Manufacturing is the second-largest phase in both the stool and the wardrobe benchmarks, at 24.6% and 26.8%. Practical moves include switching plants to renewable electricity, recovering heat from drying and curing, and reducing offcuts through nesting software and standardized panel sizes. Every kilogram of material that becomes scrap carries its raw material emissions and its processing emissions with it.
If you buy renewable power, be careful how you account for it. Our explainer on market-based vs location-based Scope 2 shows why the method you choose changes the reported result. For a broader view of factory-level levers, see our sustainable manufacturing guide.
Lever 3: Design for Durability, Repair and Reuse
The cleanest piece of furniture is the one you do not have to make again. A stool that lasts twenty years instead of five avoids three replacements and all the raw material and manufacturing emissions that come with them. The scale of the waste problem shows why this matters: the US EPA reports that furniture and furnishings generated 12.1 million tons of municipal solid waste in 2018, up from 2.2 million tons in 1960.
Design choices that extend life include replaceable upholstery and hardware, standard fasteners, available spare parts and finishes that can be refreshed. Resale and refurbishment programs help too, because a reused unit displaces a new one and its full cradle-to-gate footprint. For a deeper look at closing the loop, read how circular flow reduces product carbon footprints.
Lever 4: Design for Disassembly and Recycling
End of life accounts for 13.6% of the stool and 22.0% of the wardrobe. Much of that comes from mixed-material assemblies that cannot be separated, so they end up landfilled or incinerated. Mono-material designs, screw instead of glue joints and clear material labeling make recycling realistic. The principles are covered in our design for environment guide.
What About Transport and Packaging?
Neither benchmark lists transport among its top three phases, so it is rarely the first place to look. That said, flat-pack design is a quiet win. Fitting more units per pallet lowers emissions per piece, and it reduces damage and returns. Treat logistics as a second-wave optimization once materials and construction are addressed.
Regulation Is Making This Measurable
Furniture is moving from voluntary sustainability claims to formal requirements. The EU’s ESPR working plan, adopted on 16 April 2025, lists furniture among the first product groups to be regulated, with 2028 as the indicative adoption year for furniture measures. For the details, see our ESPR complete guide. Manufacturers who already know their per-product footprint will have a head start.
How to Measure Before You Reduce
Reduction targets without a baseline are guesses. A product-level LCA following ISO 14040/44 maps your bill of materials to emission factors, shows the share per phase and lets you test scenarios, such as swapping a foam, changing a panel supplier or extending a warranty. Rerun the model after each change so you can show the delta. That is the foundation of any credible furniture carbon footprint reduction plan, and it protects you from vague claims. If you want to see how to build one, you can calculate your product carbon footprint with a structured, auditable approach.
Frequently Asked Questions
What is the biggest source of emissions in furniture? Materials. In the stool benchmark they make up 52.7% of the total, and in the wardrobe benchmark 39.9%. Manufacturing is typically next, followed by end of life for bulky items.
How can I reduce the carbon footprint of the furniture I sell? Start by finding your hotspot with a product-level LCA. Then work down the list: lower-carbon materials and recycled content, efficient and renewable-powered production, longer-lasting design, and construction that can be repaired or taken apart at the end of its life.
Is wooden furniture always lower carbon than metal or plastic? No. Wood can store carbon during use, but adhesives, finishes, processing and end of life all affect the net result. Accounting rules for biogenic carbon also differ, so a fair comparison needs the same system boundaries for each material.
Does extending furniture lifespan really cut emissions? Yes, because each additional year of use spreads the embodied emissions over more service and delays the need for a replacement. Durable construction, spare parts and repair options are among the most reliable ways to lower impact per year of use.
Want to know whether panels, hardware or end of life is driving your range’s footprint? Devera maps ISO 14040/44 to your own bill of materials, so you can see phase-by-phase results and test design changes before they reach production. Explore the platform to see how it fits your furniture portfolio.