
Pharmaceutical Carbon Footprint: A Complete LCA Guide
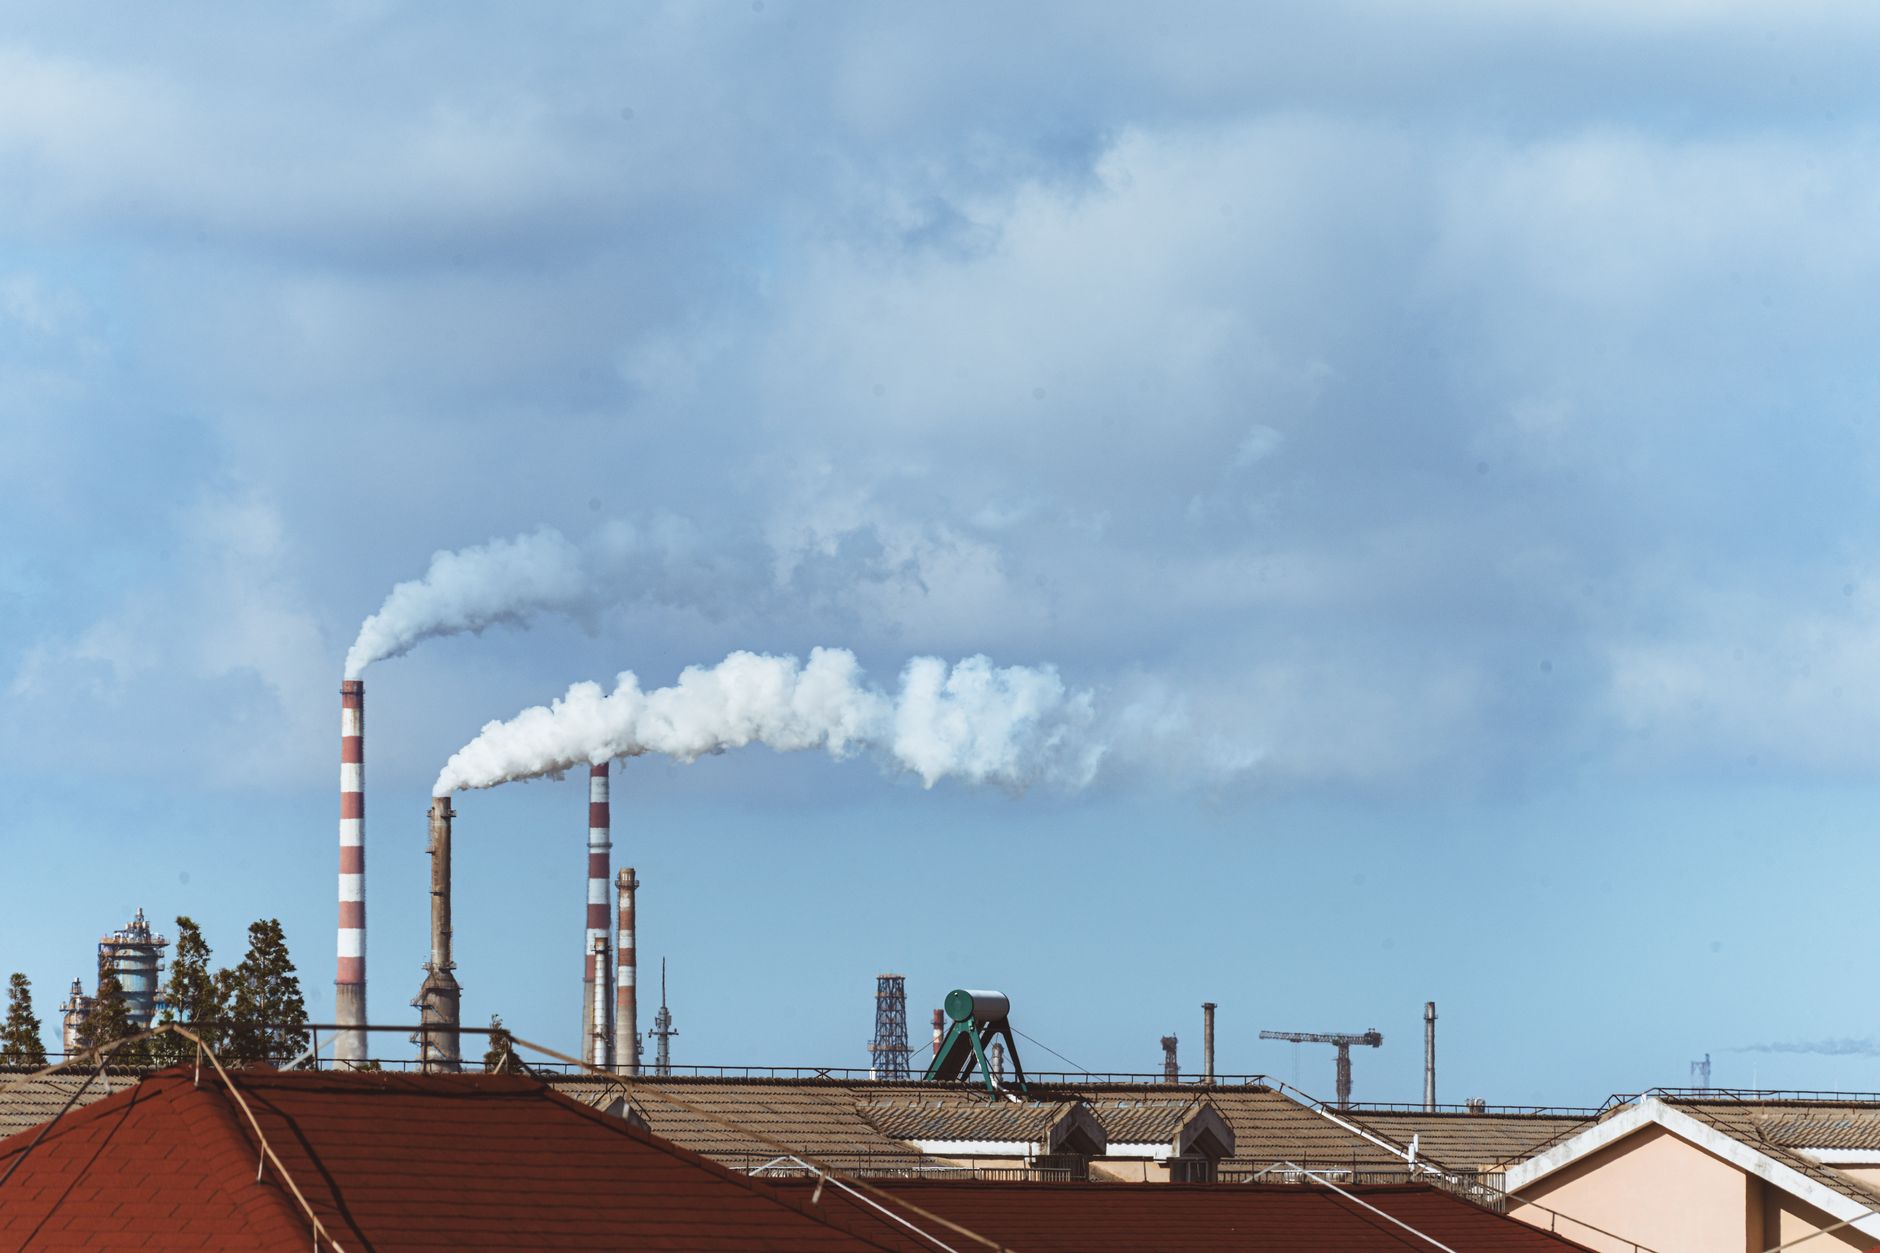
Photo by [女子 正真](https://www.pexels.com/photo/industrial-factory-emissions-against-urban-skyline-33944133/) on Pexels
AI-generated article. Figures and regulatory references link to primary sources.
The pharmaceutical carbon footprint is larger, and more misunderstood, than almost any other industrial sector. Relative to its revenue, the pharmaceutical industry produces 55% more greenhouse gas emissions than the automotive sector, an industry most people would instinctively rank as far more polluting. And the problem is accelerating: greenhouse gas emissions related to pharmaceutical consumption increased by 77% over the past 24 years, according to a Leiden University study published in The Lancet Planetary Health. For sustainability and LCA teams at pharmaceutical manufacturers, contract development organizations (CDMOs), and the consultants who serve them, the pressure to quantify, report, and reduce product-level emissions has never been greater. This guide explains what drives the pharmaceutical carbon footprint, how to measure it correctly under ISO 14040/44, and where the real levers for reduction sit.
Key Takeaways
- While the top 25 public pharmaceutical companies have reduced their Scope 1 and 2 emissions, overall carbon intensity is rising due to smaller and private firms, and Scope 3 emissions represent 82% of the industry’s total carbon footprint.
- Corporate emissions (34.5%), API production (28.5%), and medicine manufacturing (25.5%) are the most impactful contributors to medicine carbon footprints, while packaging (5.3%), transport (3.6%), and excipients (2.7%) contribute less significantly.
- Pharmaceutical manufacturing is resource-intensive, often generating 25 to 100 kilograms of chemical waste for every one kilogram of active drug produced.
- Product Carbon Footprints (PCFs) calculated under ISO 14067 and ISO 14040/44 are increasingly necessary to satisfy CSRD ESRS E1 disclosures, supplier engagement programs, and formulary carbon labeling requirements.
- The hotspot in pharmaceutical LCA almost always sits upstream in API synthesis, not in finished-dose packaging, challenging where most reduction efforts are currently focused.
Why the Pharmaceutical Sector’s Emissions Are Hard to See
One reason the pharmaceutical industry’s climate impact is so frequently underestimated is that the carbon is largely invisible. Emissions are largely invisible due to globalization and lack of oversight, and reducing consumption and waste is crucial, with government intervention needed. Unlike a steel mill or a cement plant, a pharmaceutical facility can look clean and modern while its largest emission source sits thousands of kilometers away in an active ingredient synthesis plant in Asia or India.
Most emissions still come from supply chains, representing about 75% for public companies and 88% for private companies, highlighting why Scope 3 remains the defining challenge. When procurement teams choose an API supplier on price alone, they are implicitly making a carbon decision, often without any data to support it.
Scope 3 emissions in pharmaceuticals include purchased goods and services such as the emissions from Active Pharmaceutical Ingredient (API) synthesis, capital goods like the construction of facilities, upstream transportation, use of sold products, and disposal of products at end-of-life. This breadth makes the pharmaceutical carbon footprint a supply chain problem first, and an operational problem second.
The API Problem: Where the Carbon Actually Lives
Ask most pharma sustainability managers where the biggest single driver of a medicine’s carbon footprint is, and many will point to packaging or cold-chain logistics. The data tells a different story.
A study mapping the carbon footprint of the entire French pharmacopeia found that corporate emissions (34.5%), API production (28.5%), and medicine manufacturing (25.5%) are the most impactful contributors to medicine carbon footprints, while medicine packaging (5.3%), transport (3.6%), and excipients (2.7%) are less significant. In other words, the bottle, the blister pack, and the last-mile delivery combined contribute less than 12% of a typical medicine’s lifecycle emissions.
To put those upstream numbers in concrete terms, consider how they compare to products outside pharma. Devera’s ISO 14040/44 LCA benchmarks show that a single container of body cream carries a median footprint of 2.50 kg CO₂e, with 47.7% of that impact driven by raw materials and 17.1% by packaging. Body cream’s packaging share alone (17.1%) is three times larger than the packaging contribution for a typical oral medicine (5.3%). The contrast reveals a counterintuitive truth: pharmaceutical packaging, despite appearing more complex and clinical, is a relatively minor lever compared to the chemical synthesis upstream.
The reason lies in the chemistry itself. Solvents typically account for 80% to 90% of the total mass in pharmaceutical processes and are the largest contributor to Process Mass Intensity (PMI). Producing one kilogram of API can release anywhere from 50 to 1,000 kg of CO₂ into the atmosphere. The range is vast because it depends entirely on synthesis route, solvent selection, energy source at the manufacturing site, and how many steps the process requires.
Due to the high carbon footprint of the active pharmaceutical ingredient, formulation process yields have the greatest impact on overall carbon footprint, although emissions from equipment energy, cleaning, and facility overheads also contribute.
How to Measure the Pharmaceutical Carbon Footprint Correctly
The ISO 14040/44 Framework for Medicines
Life Cycle Assessment under ISO 14040/44 is the methodological backbone for any credible pharmaceutical PCF. The French government’s official medicines carbon footprint methodology, developed in line with EU PEF guidance, confirms this: the LCA methodology follows ISO 14040 and ISO 14044, with the functional unit of a medicine’s LCA defined as the treatment for a specific pathology of a well-defined patient type over a given period, such as one year, with the reference flow corresponding to the number of boxes of medication required to provide this treatment.
That choice of functional unit matters enormously. Expressing impact per tablet will produce a very different decision framework than expressing it per defined daily dose (DDD) or per treatment course. When sustainability teams use inconsistent functional units across a formulary, comparisons become meaningless and reduction targets impossible to set.
Scope of Assessment: Cradle-to-Gate vs. Cradle-to-Grave
Most pharmaceutical LCA work currently uses a cradle-to-gate boundary, covering API synthesis, excipients, manufacturing, and packaging up to the point of market release. A full cradle-to-pharmacy-gate LCA encompasses the entire medicine-related carbon footprint, including active pharmaceutical ingredient (API), excipients, and packaging production, transport, medicine manufacturing, and associated corporate emissions.
Extending the boundary to cradle-to-grave adds patient use (inhalers with propellant gases, for example) and end-of-life disposal of unused medicines and packaging. While the ISO standards offer comprehensive, industry-neutral guidance for conducting LCAs, they do not yet specify the methodological choices or data requirements for pharmaceutical product groups, leaving LCA practitioners with considerable discretion that can produce varying environmental footprint results for the same product. This methodological inconsistency is exactly why sector-specific Product Category Rules (PCRs) and harmonized approaches, aligned with ISO 14067, are urgently needed.
Data Gaps and How to Close Them
Data availability is the number-one practical challenge in pharmaceutical LCA. One consistent finding in most LCA work reviewed is the challenges encountered with data availability. API synthesis routes are often proprietary, contract manufacturers may not disclose energy consumption data, and multi-regional supply chains span jurisdictions with wildly different grid emission factors.
Research from Leiden University suggests that although the API carbon footprint is correlated with synthesis yield, its number of steps, presence of chiral centers, and process mass intensity, the API carbon footprint is better predicted by its wholesale cost, offering a pragmatic proxy when primary data is unavailable. This is useful for initial screening, but primary supplier data remains the gold standard for CSRD reporting purposes.
Compare this complexity to a simpler manufactured product. Devera’s benchmark data shows that a safety equipment container carries a median of 4.47 kg CO₂e per kilogram, with a well-defined split: 57.5% from raw materials and 35.9% from manufacturing. The system boundaries are tractable. For a pharmaceutical tablet, by contrast, the raw-material equivalent (the API) alone can carry a footprint an order of magnitude higher per gram of active substance, and the data to prove it often does not exist in a usable form. That data gap is not an excuse to avoid measurement. It is the reason rigorous LCA methodology matters.
Regulatory Pressure: CSRD, ESRS E1, and the Scope 3 Mandate
For large pharmaceutical companies operating in or selling into the EU, carbon reporting is rapidly becoming non-negotiable. Under ESRS E1 of the Corporate Sustainability Reporting Directive (CSRD), Scope 3 reporting remains mandatory for all companies where these emissions are material, regardless of sector or location.
The CSRD has been revised under the EU Omnibus package. Mandatory CSRD reporting now applies to companies with more than 1,000 employees and annual turnover exceeding €450 million, while listed SMEs are no longer automatically in mandatory scope. But even with the narrowed company scope, Scope 3 GHG disclosure requirements have been preserved in the simplified ESRS standards progressing through EU adoption in 2026.
For pharmaceutical companies, this creates a direct demand signal to suppliers for product-level carbon data. Only data obtained directly from value chain partners, such as supplier-reported emissions, EPDs, and PCFs, is classified as primary data under ESRS E1. Spend-based estimates will satisfy initial disclosures but will not survive external assurance scrutiny over time. Pharmaceutical manufacturers who begin building ISO 14040/44-compliant PCF libraries now will be better positioned than those waiting for regulatory deadlines to force the issue.
Sanofi’s approach illustrates the direction of travel: their Environmental LCA reports provide transparent, ISO-compliant insights into the environmental performance of their medicines and vaccines, with each report compliant with ISO 14040/14044 standards and critically reviewed by an independent expert, ensuring transparent and accurate results for public disclosure.
Reduction Strategies That Actually Move the Needle
Green Chemistry and API Process Redesign
Given that API production represents over a quarter of a medicine’s total carbon footprint, process redesign is the single highest-leverage intervention available. Pharmaceutical company Lupin demonstrated this by adopting green-chemistry principles: it streamlined the manufacturing of 14 APIs, cutting solvent and reagent consumption by 61 percent and reducing synthesis steps by 33 percent.
Switching from batch to continuous manufacturing can have a similarly outsized effect. Continuous manufacturing instead of batch manufacturing has been effective in curbing carbon emissions by almost 70%. These are not marginal improvements. They represent the kind of step-change reductions that make a meaningful difference to a medicine’s lifecycle footprint, and they happen upstream, not at the packaging line.
Solvent Substitution and Recovery
Solvents account for 56% of all materials consumed in pharmaceutical production, and most are petroleum-derived, volatile, and toxic. Improving solvent recovery rates and substituting high-impact solvents with greener alternatives (such as bio-based ethyl lactate or glycerol) addresses both the process mass intensity and the direct carbon emissions from incineration of waste solvent streams.
Supply Chain Engagement and Renewable Energy
Between 35% and 40% of the sector’s emissions could be reduced without increasing costs, through measures such as renewable energy use, replacement of high-impact solvents with greener alternatives, and more efficient continuous manufacturing processes. For scope 3 in particular, the levers sit with suppliers. Engaging API manufacturers on renewable electricity commitments and sharing PCF data through the value chain are among the most cost-effective actions a brand-level pharmaceutical company can take. As brands that measure show, the act of quantification itself changes procurement conversations.
Packaging: A Real but Secondary Lever
Packaging deserves attention, even if it is not the primary driver. For solid oral dosage forms, packaging contributes roughly 5% of lifecycle emissions. For devices like metered-dose inhalers, the propellant gas can dominate the entire footprint, making it a genuine hotspot that packaging redesign alone cannot solve. GSK, for example, is working to find a low-carbon propellant for its metered-dose inhalers, aiming to reduce their emissions by about 90%.
Building a PCF Program for a Pharmaceutical Portfolio
Measuring the pharmaceutical carbon footprint at portfolio scale requires a consistent methodology, defensible data sources, and a system that can handle the complexity of global supply chains. The practical steps are straightforward in principle, even if challenging in execution.
First, define the functional unit and system boundary consistently across your product range. Using defined daily dose (DDD) as a comparator enables cross-molecule benchmarking and supports formulary-level carbon labeling, a growing requirement from hospital procurement bodies. Second, collect primary data from API manufacturers wherever possible; proxy methods can cover gaps initially but should be replaced systematically. Third, align your scope of assessment with the reporting framework you are targeting, whether that is ISO 14067 for product-level declarations, the GHG Protocol Product Standard for corporate disclosures, or EU PEF for comparative environmental claims.
Given that pharmaceutical products are complex, with global supply chains, it is even more critical to have a consistent harmonized methodology across the sector. Until sector-specific PCRs are finalized, ISO 14040/44 and ISO 14067 provide the strongest available methodological foundation, and their use as the basis for third-party-verified PCF declarations is already becoming a differentiator in tender processes.
For sustainability teams who need defensible numbers at product level, not corporate-average estimates that mask the real hotspots, calculate your product carbon footprint with a methodology mapped to your own bill of materials. Devera’s ISO 14040/44-compliant platform handles the supply chain complexity pharmaceutical products demand, from API-level emission factors to packaging and distribution, and delivers audit-ready outputs that hold up to CSRD scrutiny. See how it handles pharmaceutical portfolios at Devera pricing.
Frequently Asked Questions
What is the pharmaceutical carbon footprint and why is it so large? The pharmaceutical carbon footprint covers all greenhouse gas emissions across a medicine’s lifecycle, from raw material extraction and API synthesis through manufacturing, packaging, distribution, and end-of-life disposal. It is disproportionately large because API chemical synthesis is extremely energy- and solvent-intensive, with industry research showing that producing a single kilogram of active ingredient can generate between 50 and 1,000 kg of CO₂e depending on synthesis complexity. The global pharmaceutical sector’s emissions have grown 77% between 1995 and 2019, outpacing the global average rise of 49%.
How is a pharmaceutical product carbon footprint measured under ISO 14040/44? A pharmaceutical PCF follows the four-phase LCA framework defined in ISO 14040 and ISO 14044: goal and scope definition, life cycle inventory (LCI), life cycle impact assessment (LCIA), and interpretation. The functional unit is typically expressed as a treatment course, a defined daily dose, or a single unit (tablet, vial, or capsule), and the system boundary most commonly runs from cradle-to-pharmacy gate. ISO 14067 provides additional specificity for carbon-only declarations and is increasingly required when making public comparative green claims about medicines.
Which lifecycle stage contributes most to a medicine’s carbon footprint? Contrary to what many assume, packaging and logistics are minor contributors. Studies covering thousands of oral medicines consistently find that corporate emissions, API production, and medicine manufacturing together account for nearly 90% of a product’s total carbon footprint. Packaging contributes roughly 5% and transport under 4%, making upstream chemistry the dominant hotspot and the most impactful area for reduction investment.
How does CSRD affect pharmaceutical companies’ carbon reporting obligations? Under CSRD’s ESRS E1 standard, in-scope pharmaceutical companies must disclose Scope 1, 2, and 3 greenhouse gas emissions, with Scope 3 mandatory where it is material. Following the 2026 Omnibus revisions, mandatory CSRD reporting applies to companies with over 1,000 employees and more than €450 million in annual turnover. Because more than 80% of pharmaceutical emissions sit in the supply chain, this effectively requires product-level carbon data from API and excipient suppliers, making ISO 14040/44-compliant PCFs a practical necessity for compliance, not just a voluntary best practice.