
Dairy Carbon Footprint Methodology: The Complete LCA Guide
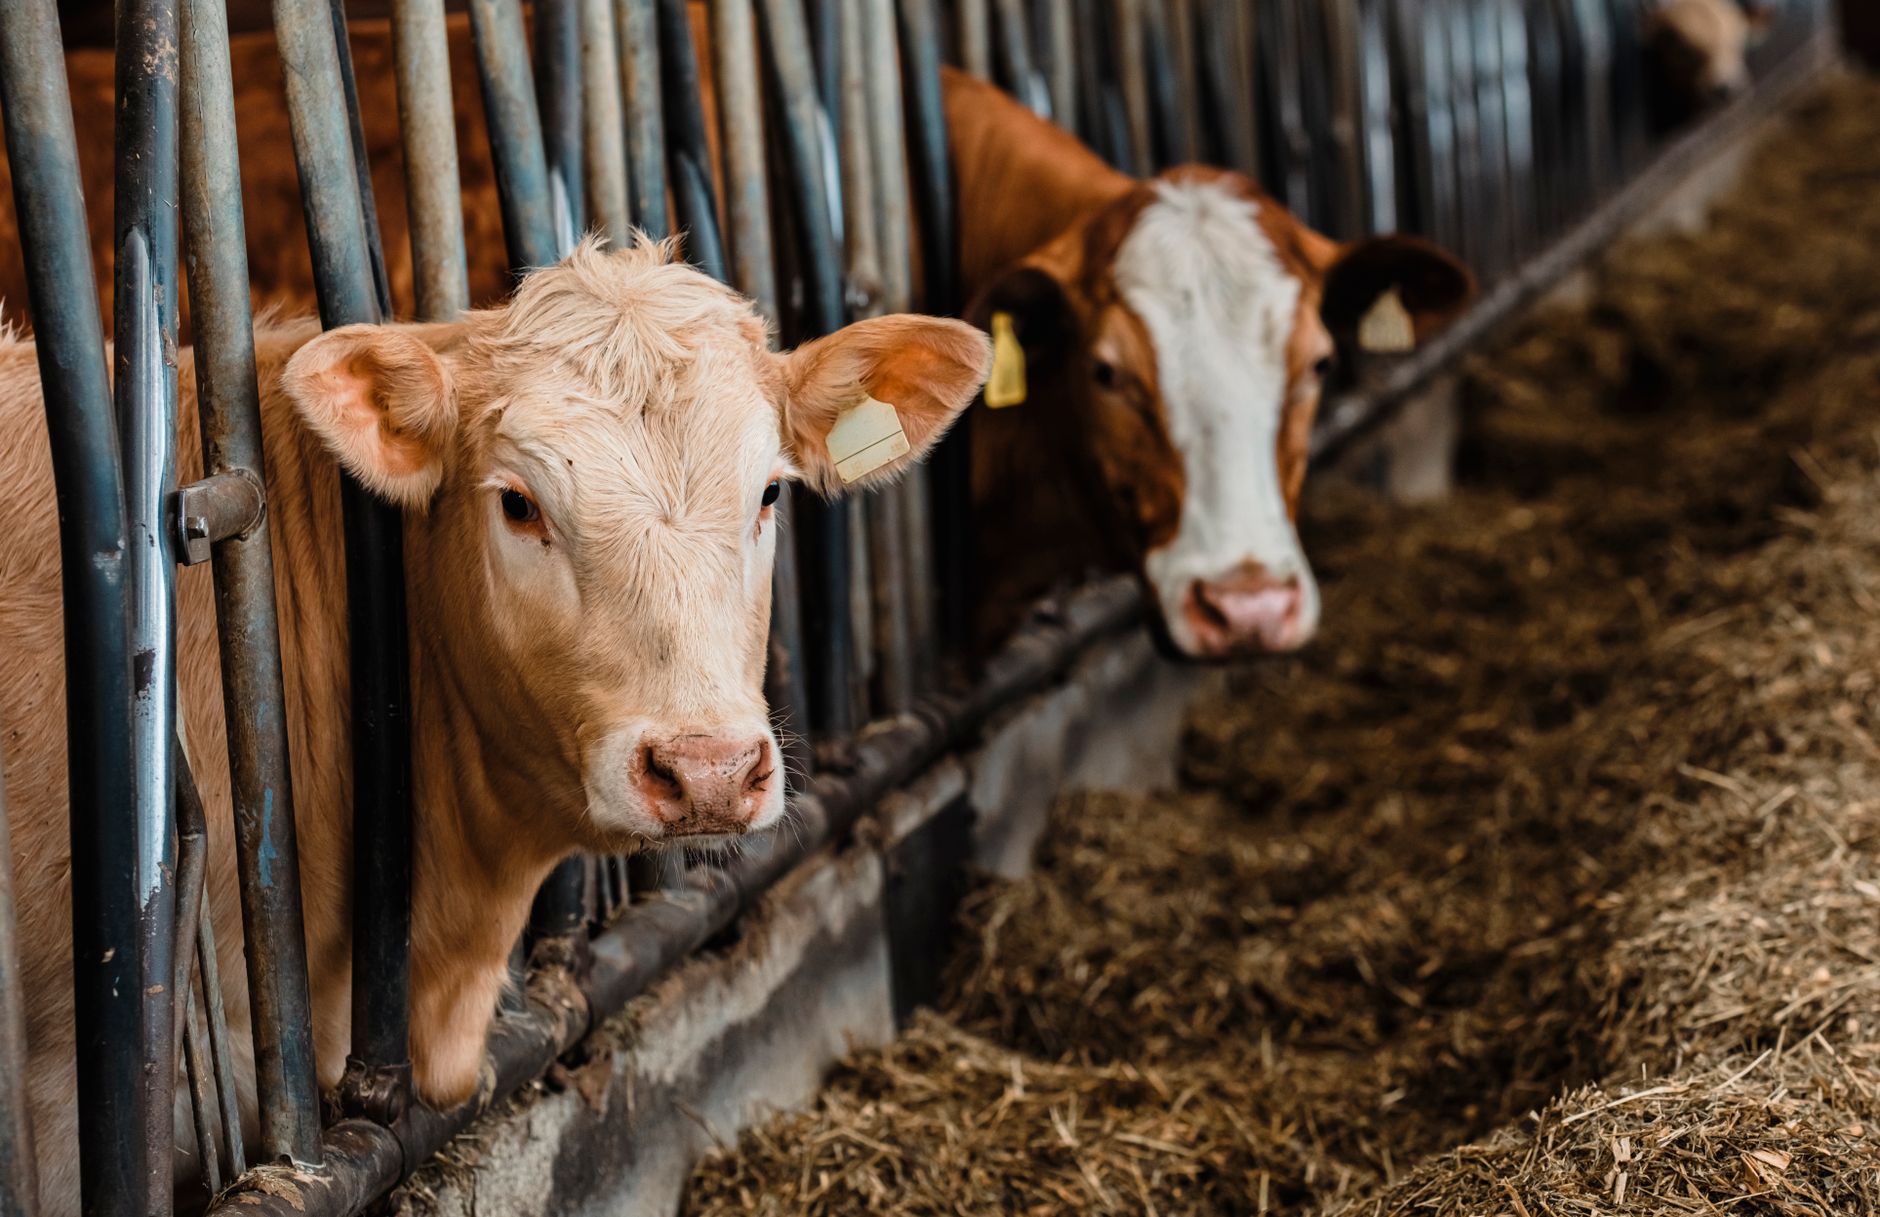
Photo by [U.Lucas Dubé-Cantin](https://www.pexels.com/photo/cows-in-a-barn-looking-through-feeding-stalls-37692161/) on Pexels
AI-generated article. Figures and regulatory references link to primary sources.
The dairy industry sits at the centre of one of the most methodologically complex challenges in product sustainability: how do you calculate a carbon footprint when your primary product comes from a living animal that emits methane, produces co-products, consumes water-intensive feed, and operates across wildly varying regional systems? Dairy carbon footprint methodology has evolved considerably over the past two decades, drawing on ISO 14040/44 life cycle assessment standards and sector-specific guidance to make sense of this complexity. According to a peer-reviewed analysis published in PubMed, the global dairy sector alone emits approximately 4.0% of total anthropogenic GHG emissions, a figure large enough to demand rigorous, comparable measurement. This guide explains precisely how that measurement is done: from setting system boundaries and choosing functional units, to handling co-product allocation and interpreting where impact actually concentrates.
Key Takeaways
- The standard dairy carbon footprint methodology follows ISO 14040/44 and sector-specific IDF guidance, covering four defined phases: goal and scope, inventory analysis, impact assessment, and interpretation.
- Enteric fermentation, methane produced during cattle digestion, is consistently the single largest source of dairy GHG emissions, accounting for roughly 71% of UK dairy cattle emissions and representing the primary hotspot targeted by improvement scenarios.
- The choice of functional unit (mass-based vs. fat-and-protein-corrected milk, or FPCM) and the allocation method used for co-products can shift a farm’s calculated footprint by more than 15%, making methodological transparency essential for comparability.
- Regional variation is substantial: US raw milk production averaged 1.38 kg CO₂e/kg FPCM in 2020, but figures ranged from 1.24 to 1.87 kg CO₂e/kg FPCM across different production regions.
- Comparing dairy against plant-based alternatives using LCA reveals that the dominant hotspot shifts from agricultural processes (in dairy) to manufacturing and packaging (in plant-based products), making cross-category comparisons methodologically treacherous without a consistent framework.
Why Dairy Is Methodologically Distinct
Most manufactured products follow a relatively linear carbon story: extract raw materials, process them, package them, transport and use them, then dispose of them. Dairy does not. A single cow simultaneously produces milk, meat, and manure, consumes feed grown on land that may have changed use in recent decades, and emits biogenic methane with a different atmospheric warming dynamic from fossil CO₂.
This is why the IDF developed a sector-specific guide to standard life cycle assessment methodology for dairy, rather than relying solely on the generic ISO 14040 framework. The purpose of this methodology is to give the global dairy sector “a robust benchmark for calculating carbon footprints for pre-competitive discussions” and to support continued progress in applying new technologies to reduce sectoral GHG emissions. That guide was updated at the IDF World Dairy Summit 2022 to incorporate the latest IPCC AR6 global warming potential values and specific guidance on biogenic methane, areas where previous standards had left significant room for inconsistency.
Understanding how this methodology works, and where its complexity concentrates, is increasingly important for any food or ingredient brand operating in the dairy supply chain. It is also essential context for understanding how the numbers published by competing actors can appear so different from one another, even when describing ostensibly similar products.
The Four Phases of a Dairy LCA
As with any ISO-aligned assessment, the four steps for conducting a dairy carbon footprint follow the LCA structure defined in ISO 14040: goal and scope definition, life cycle inventory analysis, impact assessment, and interpretation. In the dairy context, each of these phases carries particular complexities.
Phase 1: Goal, Scope, and System Boundaries
Defining the system boundary is the first, and arguably most consequential, decision in any dairy LCA. The LCA method systematically analyses production systems to account for all inputs and outputs for a specific product within a specified system boundary, and that boundary is largely dependent on the goal of the study.
In practical terms, most dairy LCAs are conducted on a cradle-to-farm-gate basis (covering feed production, on-farm processes, and farm energy use) or extended to the manufacturing gate (incorporating processing). Fully cradle-to-grave studies that include retail, consumer refrigeration, and end-of-life packaging are rarer but increasingly relevant as brands make product-level sustainability claims. To understand when each boundary is appropriate, the Devera guide on cradle-to-gate vs. cradle-to-grave provides a useful decision framework.
GHG emissions associated with milk production arise from several activities across the full dairy supply chain, including the use of agricultural inputs such as fertilisers, fossil fuel for feed production, processing in cattle feed plants, enteric fermentation, manure management, and post-farm-gate activities such as milk processing, conversion into dairy products, and retail distribution. Which of these activities falls inside the boundary depends entirely on the study’s stated goal, and this is a primary reason why dairy carbon figures from different sources are often incomparable without understanding the methodological documentation behind each number.
Phase 2: Choosing the Functional Unit
The functional unit is the reference quantity against which all environmental flows are expressed. There are many units which can be used for dairy farms: volume (litres of milk), kilograms of protein, or kilograms of milk fat. However, mass-based units alone create comparability problems because milk composition varies significantly by breed, region, and production system.
The IDF recommends fat-and-protein-corrected milk (FPCM) as the preferred functional unit, defined by a formula that corrects for actual fat and protein content, ensuring that a high-fat milk from one farm is genuinely comparable to a lower-fat milk from another. This is not a trivial adjustment. The choice of functional unit directly affects how emissions are attributed per unit of product, and a purely mass-based approach can systematically understate or overstate the true emission intensity of different operations.
Phase 3: The Inventory and the Allocation Problem
The life cycle inventory (LCI) phase is where all inputs and outputs across the system are quantified: feed consumption and feed production emissions, on-farm fuel and electricity, fertiliser use, animal numbers, manure management practices, and so on. For dairy farms, this inventory is dense because the main agricultural greenhouse gases include carbon dioxide (CO₂), nitrous oxide (N₂O), and methane (CH₄), each with very different global warming potentials.
The inventory then encounters one of the most debated issues in dairy LCA: allocation. When a process produces more than one output, the environmental burden has to be assigned between the outputs, such as milk and meat from a dairy cow. The IDF methodology recommends biophysical allocation at the farm level, but studies using economic, protein-based, energy-based, or mass-of-carcass-weight allocation methods all yield different results. For an average Irish dairy farm, for example, allocation factors for milk ranged from 75% to 89% depending on the method chosen, resulting in farm-gate footprints ranging from 1.04 to 1.22 kg CO₂e/kg FPCM from that methodological choice alone.
This is why published dairy footprint figures can appear to conflict with one another even when they describe similar farms: the numbers are only comparable when the methodology is comparable.
Phase 4: Impact Assessment and Interpretation
All GHG emissions associated with the production processes are converted into mass of CO₂ equivalent according to the latest IPCC GWP values and summed to obtain the total CO₂e, which is then divided by the total production yield to give the footprint per functional unit. The IDF’s 2022 revision added specific guidance on using IPCC AR6 values on a 100-year basis, including carbon feedback, an important update given ongoing scientific debate about how to properly account for biogenic methane in warming calculations.
Interpretation then involves identifying hotspots, running sensitivity analyses, and drawing conclusions for decision-makers. For dairy, interpretation almost always points to the same dominant driver.
Where the Emissions Actually Live
A recurring finding across dairy LCA literature is that enteric fermentation, the methane produced in cattle rumens during digestion, dominates the emission profile. Within UK dairy cattle emissions specifically, 71% of total emissions are from enteric fermentation, the fermentation that takes place in the digestive systems of the animals.
At the US level, a 2020 assessment of US raw milk production found that enteric fermentation contributes about 38.1 MMT CO₂e, or 27% of total emissions, representing the largest single source, with the overall footprint averaging 1.38 kg CO₂e/kg FPCM and regional variation ranging from 1.24 to 1.87 kg CO₂e/kg FPCM across 12 distinct dairy production regions. That regional range is telling: the gap between the lowest-emitting and highest-emitting regions is about 50%, driven entirely by differences in feed composition, manure management systems, and herd productivity. In other words, geography and farm management matter as much as generic product category when calculating a defensible dairy carbon number.
This stands in stark contrast to categories where manufacturing or packaging dominates. Consider Devera’s ISO 14040/44-aligned benchmark data for plant-based food alternatives: for 1 kg of a plant-based food product, the median footprint is 3.10 kg CO₂e (range: 2.42–4.41 kg CO₂e), with raw materials accounting for 41.0% of impact and manufacturing for a nearly equal 39.5%. That manufacturing share reflects the energy-intensive processing steps needed to convert raw plant ingredients into shelf-stable products. Dairy’s primary hotspot sits upstream at the farm, driven by biology; plant-based alternatives’ hotspot sits midstream, driven by industrial processing. Getting this distinction right matters enormously for product improvement strategies and for substantiating comparative claims.
The Land Use Change Question
One of the most contentious elements of dairy carbon footprint methodology is the treatment of land use change (LUC). If feed crops such as soy are grown on land that was previously forest or native grassland, the carbon released by that land conversion must be attributed to the products that prompted it, including dairy products whose feed supply chains pass through those regions.
The IDF methodology includes specific guidance on land use change, aligned with the PAS 2050 approach: the assessment should include all direct land use change occurring on or after January 1, 1990. This matters because studies that exclude LUC can significantly understate the true impact of dairy products from regions with feed supply chains rooted in deforested land.
For brands publishing product-level footprints, this is both a methodological and a credibility issue. If a supplier’s feed comes from deforestation-linked regions and LUC is excluded from the calculation, the published footprint may be materially misleading. The EU Green Claims Directive specifically requires that comparative environmental claims be substantiated by robust LCA-based evidence, which means the methodology behind a dairy carbon claim is no longer just a technical question, it is a legal one.
What the Numbers Mean at Product Scale
The farm-gate footprint of dairy milk is often reported as a relatively compact number, typically between 1.0 and 2.0 kg CO₂e per kg of FPCM for well-managed systems. But this figure is only part of the story for finished dairy products. Processing milk into cheese concentrates those emissions per kilogram of final product significantly, because it takes roughly 10 litres of milk to produce one kilogram of hard cheese. Similarly, packaging choices compound the farm-gate baseline with additional upstream impacts.
Devera’s benchmark for a 750 ml soft drink illustrates how dramatically packaging can reshape a product’s total footprint: packaging alone accounts for 42.4% of the total 2.12 kg CO₂e median for that product type. For dairy brands designing packaged products, this is a useful reference point. A raw-milk footprint that looks modest at the farm gate can look very different when full packaging life cycle impacts are added, particularly for multi-layer cartons, glass bottles, or refrigerated plastic formats. The full lifecycle impact of packaging deserves its own assessment rather than a secondary note in a farm-gate LCA.
Methodological Consistency and Comparability
One of the persistent frustrations for brands, investors, and regulators trying to use dairy carbon data is the lack of comparability across studies. Although LCA is the recommended methodology to calculate the carbon footprint, several factors can influence the ability of decision makers to make comparisons between different policy plans and about improved management or mitigation practices. Those factors include functional unit choice, system boundary definition, allocation method, the inclusion or exclusion of land use change, and the GWP values used.
The IDF’s 2022 methodology revision was explicitly designed to address this: its purpose is to create an LCA global standard that can assist the dairy industry in its efforts to reduce GHG emissions across all value chains. But adoption of that standard remains uneven, and brands sourcing from multiple geographies will encounter suppliers using different underlying approaches.
This is where platforms built on ISO 14040/44-aligned LCA methodology become practically important. Standardising the inventory data, emission factors, and calculation logic across a portfolio of dairy-derived products makes it possible to produce results that are internally consistent and auditable, even when supply chains span multiple continents and production systems. For food brands that need to make substantiated green claims, that internal consistency is not optional; it is the baseline requirement for credibility.
Hotspot Analysis as a Decision Tool
Understanding the dairy carbon footprint methodology is ultimately a means to an end: identifying where intervention will have the greatest impact. The literature consistently points to feed efficiency improvements and herd productivity gains as the most effective farm-level levers, since both reduce the emissions intensity per unit of FPCM without necessarily changing the total number of animals.
High-quality feeding strategies play a crucial role in improving milk yield and reducing enteric methane emissions, nutrient excretion, and manure emissions, as demonstrated by a 2025 study of Italian dairy farms producing PDO Grana Padano cheese. The practical implication is that dairy brands sourcing from farms with active feed management programmes can legitimately claim lower upstream emissions, provided those claims are backed by farm-level data, not category-average emission factors.
For brands with broader food portfolios, running a hotspot analysis in LCA across multiple product lines can reveal which products are primarily driven by farm-gate agricultural emissions (dairy, beef, wool) versus which are dominated by manufacturing, packaging, or transport. Those structural differences shape very different reduction roadmaps.
Frequently Asked Questions
What is the standard methodology for calculating a dairy product’s carbon footprint? The recognised standard is ISO 14040/44-aligned life cycle assessment, supplemented by the International Dairy Federation’s sector-specific methodology guide, most recently updated in 2022. This framework defines four phases: goal and scope definition, life cycle inventory analysis, impact assessment, and interpretation. The IDF guide adds dairy-specific guidance on functional units, co-product allocation, biogenic methane treatment, and land use change that the generic ISO standard does not cover.
How does co-product allocation affect dairy carbon footprint results? Dairy cows produce both milk and meat, which means the farm’s total GHG burden must be divided between these co-products. Depending on whether economic, protein-based, mass-based, or physical-causality allocation is used, the share of emissions assigned to milk can vary from around 75% to 89% of total farm emissions. For an average dairy farm, this methodological choice alone can shift the calculated footprint per kilogram of fat-and-protein-corrected milk by more than 15%, which is why understanding which allocation method underlies any published figure is essential before making comparisons.
Why does the dairy carbon footprint vary so much between regions and studies? Regional variation in feed composition, herd genetics, manure management systems, energy grid mix, and land use change all drive real differences in emission intensity. Beyond actual production differences, methodological choices, particularly system boundaries, functional unit definitions, and GWP values, also create apparent variation that reflects calculation differences rather than true differences in environmental performance. US milk production data from a 2020 cradle-to-farm-gate study illustrates this well, with regional footprints ranging from 1.24 to 1.87 kg CO₂e/kg FPCM across 12 different production regions.
How should dairy brands use LCA data to substantiate green claims? Dairy brands making comparative environmental claims need LCA studies that follow a recognised methodology (ISO 14040/44 and ideally the IDF guide), disclose their system boundary and allocation choices, and are reviewed by a qualified third party. Vague claims such as “lower carbon” without specifying the basis for comparison are increasingly scrutinised under the EU Green Claims Directive and similar regulatory frameworks. The most defensible approach is to calculate product-level footprints with documented methodology and to disclose the key methodological parameters alongside the headline number.
For sustainability teams who need auditable, product-level dairy carbon numbers, not category averages, Devera maps ISO 14040/44 methodology to your own bill of materials and supply chain data, covering farm-gate inputs through to packaging. Whether you are working through a single SKU or need to cover an entire dairy portfolio, explore how Devera handles food product LCA and see what defensible scope-3 data looks like in practice.