
Last Mile Delivery Emissions: Measuring & Reducing Impact
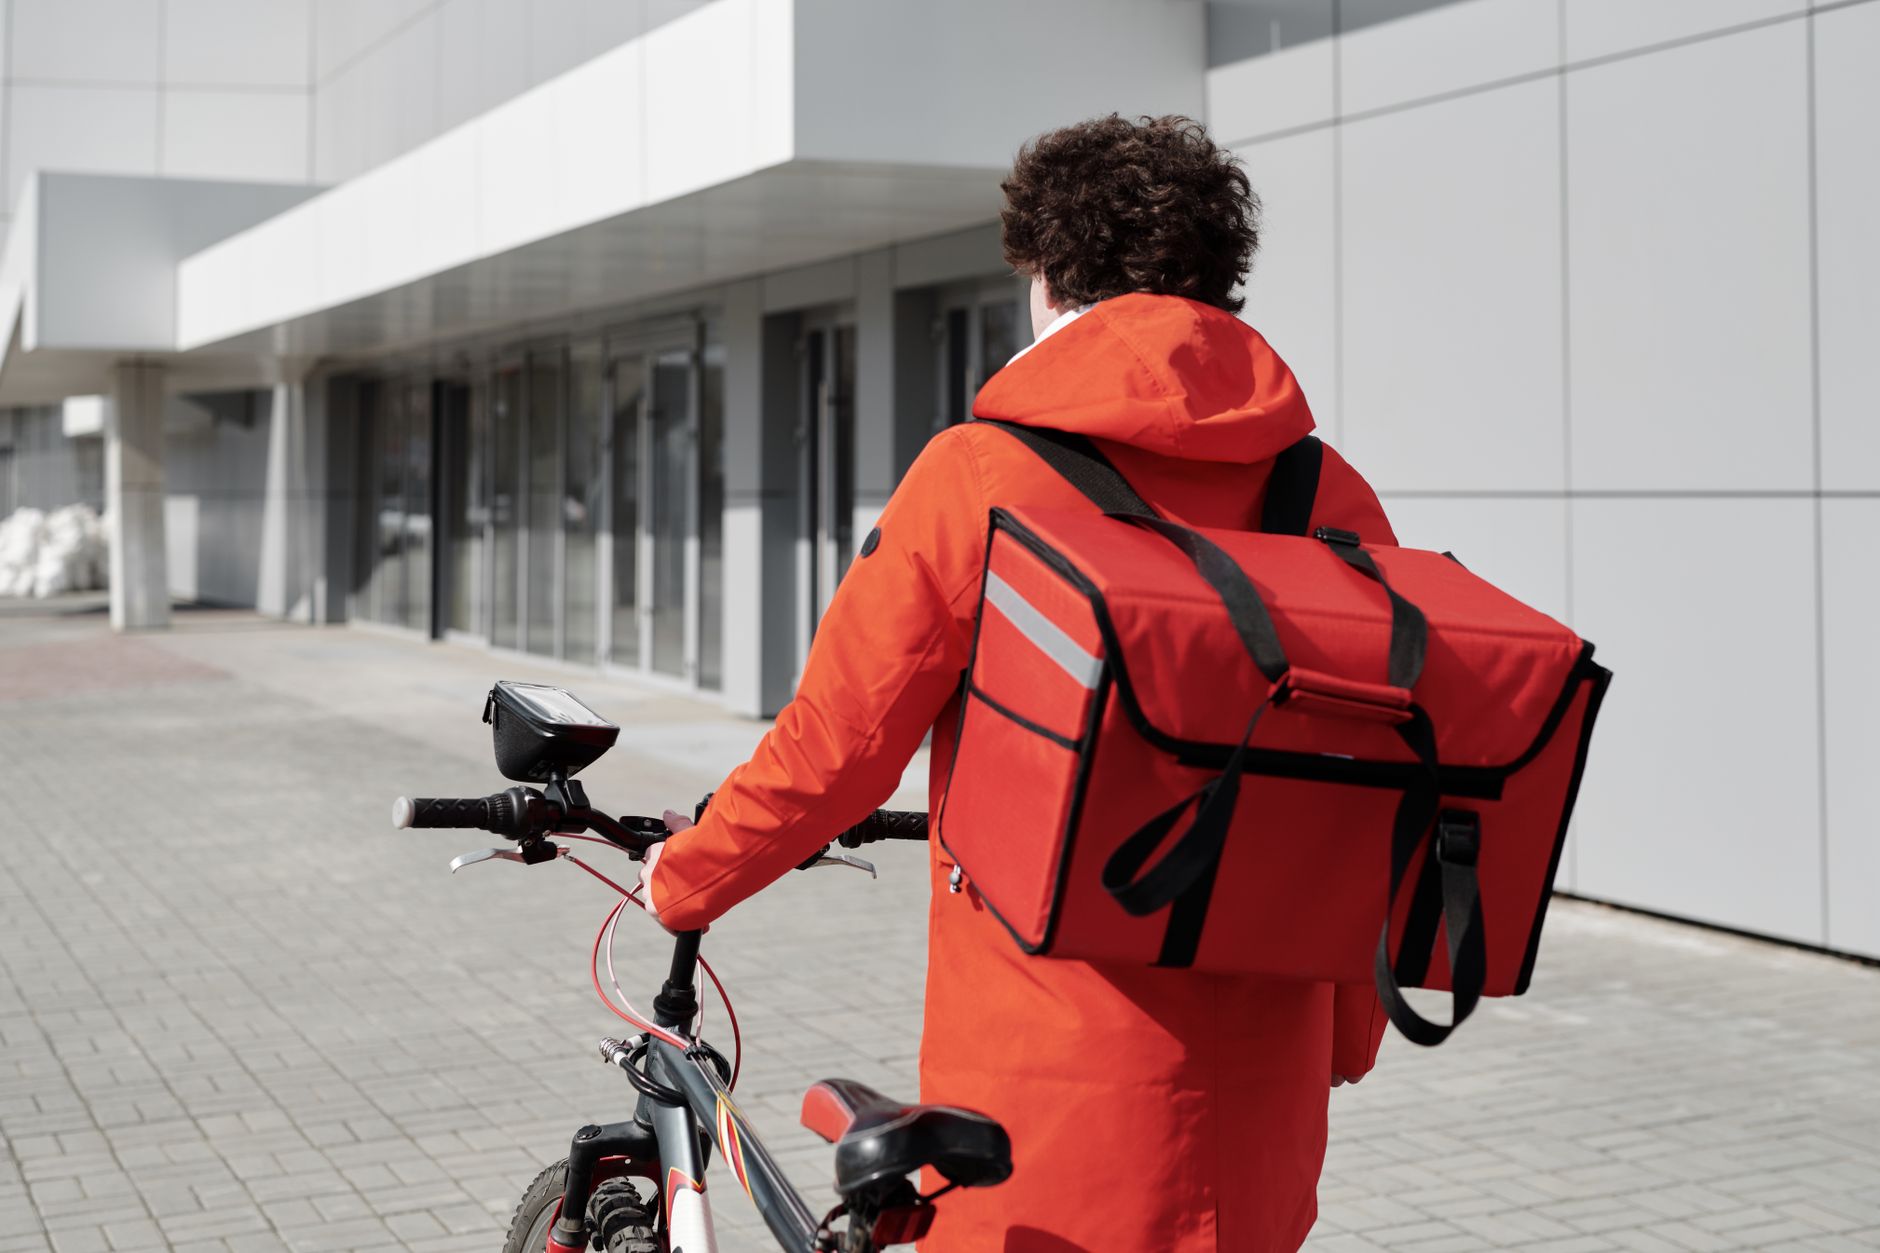
Photo by [Norma Mortenson](https://www.pexels.com/photo/a-man-carrying-thermal-bag-while-walking-4392040/) on Pexels
AI-generated article. Figures and regulatory references link to primary sources.
Last mile delivery emissions are, by most measures, the most carbon-intensive stage of the entire supply chain. A report published by the Clean Mobility Collective and Stand.earth revealed that up to 50% of total delivery carbon emissions come from the “last mile” of delivery. Put differently, everything that happens before a package leaves the local depot, including ocean freight, rail, and long-haul trucking, is matched or exceeded by the short, chaotic journey to someone’s door. For sustainability and LCA teams at brands and manufacturers, this matters enormously: once product-level carbon footprints are calculated, the transport stage that sits at the very end of the value chain can quietly dwarf assumptions. This post explains what last mile delivery emissions are, why they are so hard to measure accurately, how they sit within regulatory frameworks like the GHG Protocol and CSRD, and what the LCA perspective reveals about where the real hotspots lie.
Key Takeaways
- Last mile delivery can account for up to half of all total delivery carbon emissions, making it the single most emissions-intensive stage per distance traveled.
- Under the GHG Protocol, last mile emissions for sold products fall into Scope 3 Category 9, which is now a mandatory disclosure category under CSRD’s ESRS E1 standard.
- The carbon weight of a product determines how transport emissions factor into its overall footprint: lightweight consumer goods carry a proportionally larger delivery burden than heavy industrial items delivered in bulk.
- Without intervention, eCommerce parcel delivery could reach 5.5 million metric tonnes of CO₂ by 2032, although electrification and alternative delivery methods could reduce emissions by over 90% in the next decade.
- Measuring last mile delivery emissions accurately requires activity-based data at the shipment level, not spend-based estimates, if the resulting numbers are to withstand audit.
What Last Mile Delivery Actually Means
The term “last mile” is slightly misleading. Instead of one vehicle carrying a full load between two points, the last mile requires many vehicles making frequent short trips to dispersed addresses, usually in congested streets. Each trip involves repeated stops, low vehicle utilization, tight delivery windows, and a meaningful chance that nobody is home. This structural inefficiency is what makes last mile delivery emissions so disproportionately large relative to the physical distance covered.
Last-mile delivery accounts for 53% of total shipping costs and 13% of total city carbon emissions. For brands selling physical goods through e-commerce, those city-level emissions eventually become line items in their Scope 3 reporting. The scale of the problem is growing: globally, final-mile delivery emissions are projected to rise 60% by 2030 without intervention.
Where Last Mile Sits in the LCA and Regulatory Picture
Scope 3 Category 9: The Regulatory Home for Delivery Emissions
Under the GHG Protocol Corporate Value Chain Standard, downstream transport belongs to Scope 3 Category 9. Scope 3 Category 9 captures greenhouse gas emissions from the transportation and distribution of products sold by the reporting company between the company’s operations and the end consumer. This includes emissions from transportation by third-party logistics providers, retailers, and distributors who move the company’s products through the supply chain after they leave the company’s operational control.
Importantly, the Corporate Sustainability Reporting Directive (CSRD) mandates companies to report Scope 3 emissions using established frameworks like the GHG Protocol. Under CSRD’s ESRS E1 standard, Scope 3 must be broken down by significant categories, typically purchased goods and services, upstream and downstream transport, use of sold products, and end-of-life treatment. That means last mile delivery emissions are no longer a voluntary disclosure footnote but a required, auditable figure for companies within CSRD scope. For brands whose logistics partners report inconsistently or not at all, this creates an immediate data gap.
Logistics clients increasingly require verified emissions data per shipment or per tonne-kilometre to meet their own CSRD Scope 3 reporting obligations. A logistics company that cannot provide this data risks losing contracts to competitors who can.
How Product Weight and Volume Shape the Last Mile Carbon Burden
This is where LCA thinking adds something that corporate carbon accounting alone misses. The transport-phase contribution to a product’s carbon footprint varies enormously by product type. Bulky, heavy items shipped in consolidated freight see a very different emission profile per unit than lightweight parcels dispatched individually from a fulfilment centre.
Consider what Devera’s LCA benchmark data reveals about two products at opposite ends of the weight and density spectrum. A fresh apple has a median carbon footprint of 1.11 kg CO₂e per kilogram, and transport accounts for 21.3% of that total, the third-largest phase across its lifecycle. Apples travel in consolidated refrigerated loads, yet even then, transport is nearly tied with end-of-life (22.8%) as an impact driver. Now contrast that with a wardrobe unit, which carries a median footprint of 159.41 kg CO₂e, where transport is not even among the top three impact phases: raw materials dominate at 39.9%, manufacturing at 26.8%, and end of life at 22.0%. A wardrobe, delivered by a single truck on a direct route, sees its transport share nearly vanish in the lifecycle picture. A kilogram of apples, shipped via chilled last-mile delivery vans making dozens of stops, sees transport as a genuine hotspot.
The implication for sustainability teams is that “last mile delivery emissions” is not a single number. It is a function of product weight, consolidation density, vehicle type, route efficiency, and fuel mix. This is precisely why a generic spend-based estimate is so inadequate for product-level reporting.
When Packaging Drives More Than the Van
There is a further counterintuitive dimension that LCA surfaces. For some lightweight consumer goods, the packaging used to ship the product generates more carbon than the actual delivery journey. Devera’s benchmark data for surface cleaner foam refill (1 kg) shows a median footprint of 1.34 kg CO₂e, where packaging alone represents 33.7% of the total lifecycle impact, while transport accounts for 17.5%. In other words, the cardboard box and bubble wrap around the product contribute roughly twice as much to the product’s carbon as the van that delivers it.
This finding should reframe how brands approach “green delivery” initiatives. Route optimization and electric vehicle adoption are worthwhile, but for lightweight household products, the packaging choices that surround a shipment may matter more to the overall product carbon footprint than the fuel consumed in the last mile. A complete, phase-resolved LCA is the only tool that reveals this hierarchy.
How to Measure Last Mile Delivery Emissions
Activity-Based vs. Spend-Based Methods
The GHG Protocol defines three calculation approaches for Scope 3 Category 9: activity-based (mass multiplied by distance multiplied by an emission factor), supplier-specific data, and spend-based estimates. The standard measurement method for downstream transport is volume shipped multiplied by distance multiplied by emission factor by mode.
Spend-based estimates are treated as a last resort because they systematically misattribute emissions. A brand that ships both heavy furniture and light cosmetics will get wildly inaccurate results if it simply divides logistics spend by an average factor. Activity-based data requires carriers to share route-level fuel consumption or tonne-kilometre figures, which in practice demands contractual data-sharing obligations. Most enterprise logistics networks operate across private fleets, contracted carriers, 3PLs, marketplace platforms, and gig delivery. Each carrier reports differently, on different cycles, in different formats, if at all. This is the single largest data-quality gap in most enterprise ESG submissions.
From Parcel-Level Data to Product Carbon Footprints
For LCA practitioners, last mile delivery emissions need to be allocated to individual products or SKUs, not just reported as an aggregate logistics figure. This requires knowing the weight and dimensions of each shipment, the mode and distance of the final leg, and an emission factor for the relevant vehicle type and fuel mix.
Emissions per parcel vary significantly depending on delivery methods, fleet composition, and regional infrastructure. For instance, the Netherlands achieved 100 grams of CO₂ per parcel in 2024, a 56% reduction from 230 grams in 2018, demonstrating the potential impact of fleet electrification and route optimization. Globally, the weighted average stands at 204 grams CO₂ per parcel. For a brand shipping thousands of SKUs, even this average masks enormous variation: certain sectors, such as fashion delivery in the UK, can generate 264 grams of CO₂ per parcel, reflecting differences in route density and vehicle types.
This variability is why the ISO 14067 standard for product carbon footprints requires that system boundary definitions be explicit about whether distribution to the final customer is included and what methodology was used to model it. A “cradle to gate” PCF that stops at the factory gate will understate impact for e-commerce brands in ways that are directly material to CSRD reporting.
Reducing Last Mile Delivery Emissions: What the Evidence Shows
Several levers have measurable impact, though the magnitude depends heavily on the baseline.
Fleet electrification is the most direct intervention. The Netherlands example above demonstrates that a 56% per-parcel emissions reduction is achievable over six years through electrification and route optimization combined. Amazon has committed to getting at least 100,000 electric delivery vehicles on the road by 2030, while FedEx has pledged to convert its entire delivery fleet to zero-emission electric vehicles by 2040.
Delivery consolidation attacks the structural inefficiency of the last mile. The final step before a package reaches the front door produces the most emissions as drivers make multiple stops, linger in traffic, and often take inefficient routes to meet tight delivery windows. Slower, consolidated deliveries reduce per-parcel emissions by increasing vehicle utilization. This is in direct tension with same-day and next-day expectations.
Out-of-home delivery networks offer a different structural solution. Research suggests that where efficient and dense out-of-home networks are in place, shifting parcels to nearby parcel lockers or pickup points could cut CO₂ emissions by up to two-thirds in urban areas. The caveat, as noted in recent research, is that this benefit disappears if customers travel by car to collect parcels from a poorly located locker. The overall environmental impact of pickup point delivery remains ambiguous when customer travel emissions are considered. When a pickup point is located more than 3 km from the customer’s home, the probability that the customer makes a round trip by car exceeds 30%. Consequently, pickup point delivery may result in higher total carbon emissions than home delivery, contrary to the intended sustainability benefits.
Failed delivery reduction is underrated. First-time delivery failure for home delivery can reach 25%. Every failed delivery generates a second journey, adding emissions with no corresponding product benefit. Better time-slot communication, smart access solutions, and dynamic rerouting all reduce this multiplier effect.
The Product-Level Perspective: Why Last Mile Emissions Cannot Be Reported in Isolation
Brands and manufacturers are increasingly expected to report emissions at the product level, not just at the corporate level. This is the territory of Product Carbon Footprints (PCFs) under ISO 14067 and Life Cycle Assessment methodology under ISO 14040/44. When transport is included in the system boundary, the allocation method matters. Does the brand allocate delivery emissions by weight, by volume, by revenue, or by number of shipments? Different choices produce dramatically different per-product results, and the choice must be documented and defensible.
For consumer electronics, for example, the last mile contribution to the total footprint is relatively small because the product’s use-phase emissions are so dominant. Devera’s benchmark data for a laptop shows a median footprint of 215.10 kg CO₂e, where the use phase alone accounts for 38.3% and raw materials for 36.5%. Transport, including last mile, is not among the top three impact phases. A sustainability team focused on the laptop’s delivery van is looking in the wrong place. The battery chemistry, the electricity grid, and the sourcing of rare materials are the real story.
This is not an argument against measuring last mile delivery emissions. It is an argument for measuring everything, so that reduction efforts are directed where they will actually move the needle. A single-phase focus, whether on production or transport, produces misleading priorities.
Frequently Asked Questions
What are last mile delivery emissions and why do they matter for brands? Last mile delivery emissions are the greenhouse gases produced during the final stage of a product’s journey, from a local distribution hub to the customer’s door. They matter for brands because they are typically the most carbon-intensive segment per kilometre of the supply chain and because they must now be reported as part of Scope 3 Category 9 under frameworks like the GHG Protocol and CSRD’s ESRS E1 standard.
How are last mile delivery emissions calculated for a product carbon footprint? The standard methodology multiplies the mass of goods shipped by the distance traveled and an emission factor specific to the transport mode and fuel type. For product-level reporting under ISO 14067, these figures must be allocated to individual SKUs using a documented allocation rule, such as by shipment weight or volume, and the system boundary must explicitly state whether last-mile distribution is included or excluded.
What is the difference between first mile and last mile delivery emissions? First mile emissions cover the movement of raw materials and goods from source to manufacturing or warehouse, typically in bulk loads with high vehicle utilization. Last mile emissions cover the final leg to the end customer, characterized by dispersed destinations, low utilization, repeated stops, and a high rate of failed deliveries. Because of this structural inefficiency, last mile delivery is significantly more carbon-intensive per tonne-kilometre than first-mile freight.
Can switching to electric delivery vans eliminate last mile delivery emissions? Electrification substantially reduces tailpipe emissions but does not eliminate the lifecycle impact. The carbon intensity of last mile delivery with electric vehicles depends on the electricity grid mix used for charging, and vehicle manufacturing itself carries embodied carbon. Fleet electrification combined with route optimization and delivery consolidation produces the largest verified reductions, as demonstrated by markets where per-parcel emissions have dropped by more than half over six years.
For sustainability teams who need defensible, product-level numbers rather than fleet-wide averages, Devera maps the full lifecycle of each product, including downstream transport, against audited emission factors from Ecoinvent and DEFRA. Whether you are completing a CSRD ESRS E1 disclosure or producing ISO 14067-compliant PCFs for your entire catalogue, Devera gives you phase-resolved results that hold up under scrutiny. Explore pricing for your portfolio size and see how product-level coverage changes what you can actually claim.