
Data Center Carbon Footprint: What It Is and How to Measure It
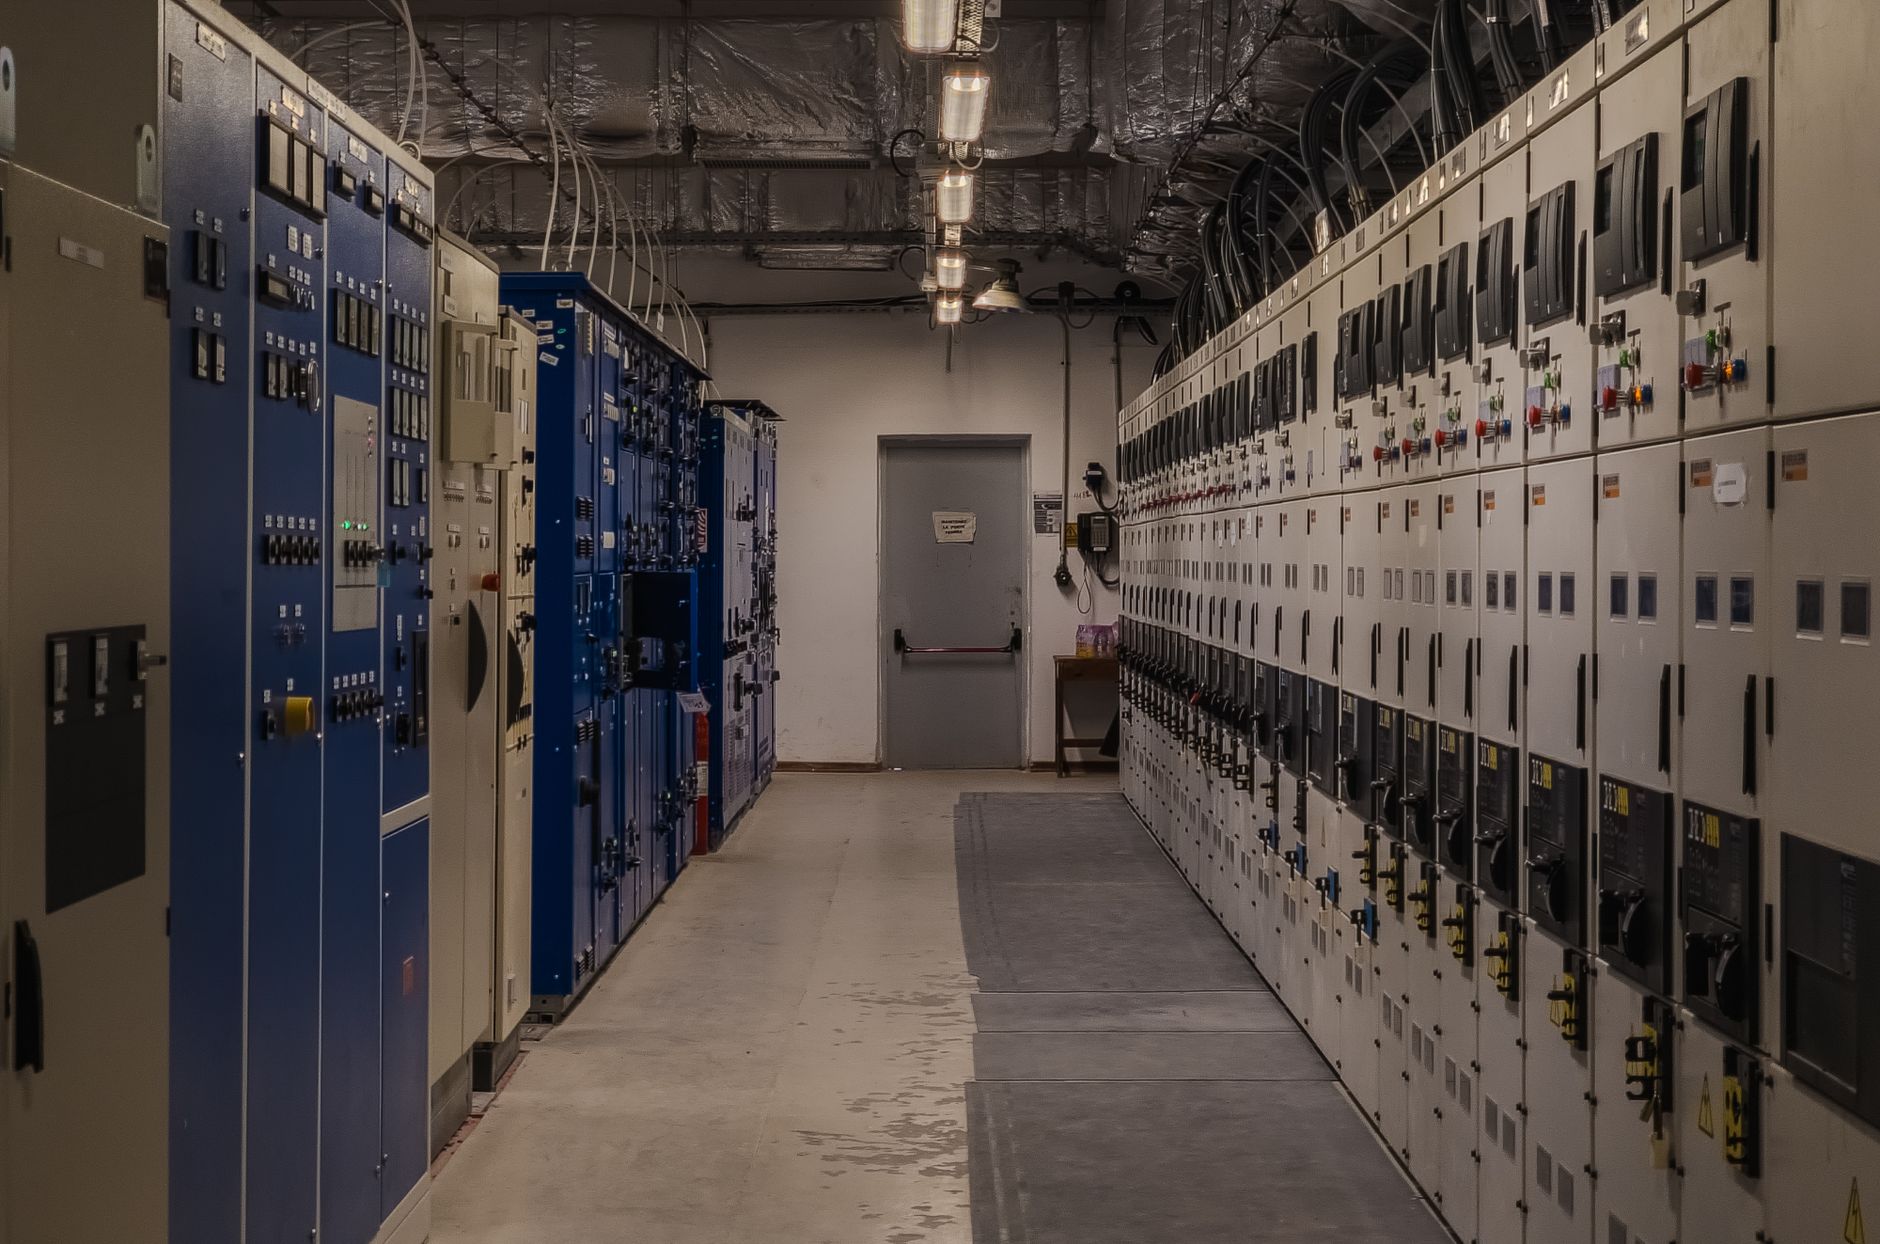
Photo by [Vjanodic WERSOV](https://www.pexels.com/photo/industrial-control-room-with-electrical-panels-38217230/) on Pexels
AI-generated article. Figures and regulatory references link to primary sources.
The data center carbon footprint is one of the fastest-growing challenges in corporate sustainability reporting. The IEA estimates data centers used roughly 1.5% of the world’s electricity in 2024, consuming approximately 415 TWh. That figure is set to more than double by 2030, with AI workloads as the primary driver. For sustainability and LCA teams at brands and manufacturers, this matters well beyond the tech sector: digital infrastructure sits inside nearly every company’s Scope 3 value chain, and regulators are increasingly demanding that it be measured, disclosed, and reduced. This post breaks down where data center carbon emissions actually come from, why the conventional measurement approach misses a significant portion of the total impact, and what a rigorous LCA-based methodology looks like in practice.
Key Takeaways
- Data centers consumed an estimated 415 TWh of electricity in 2024, and that demand is expected to more than double by 2030, reaching roughly 945 TWh, driven largely by AI workloads.
- The data center carbon footprint has two distinct components: operational emissions from electricity and cooling, and embodied (hardware manufacturing) emissions that are routinely underreported.
- Data center operations account for only about 24% of total IT sector emissions when a full lifecycle view is applied; embodied carbon from hardware manufacturing represents a further 16%, with end-user device manufacturing making up the largest share at 45%.
- Embodied emissions from hardware are measured using life cycle assessment, or LCA, calculated as CO₂e across manufacturing, assembly, use, and end-of-life disposal, as defined in ISO 14040, ISO 14044, and the GHG Protocol Product Life Cycle Standard.
- Under CSRD, Scope 3 reporting is mandatory for all in-scope companies where value chain emissions are material, governed by ESRS E1 on climate change, which requires disclosure of indirect emissions across both upstream and downstream activities.
Where Data Center Emissions Actually Come From
Most sustainability teams, when asked about the data center carbon footprint, think first about electricity bills and Power Usage Effectiveness (PUE). That instinct is not wrong, but it captures far less of the total picture than most assume.
A data center’s carbon footprint has two major components: operational emissions from running it day-to-day (electricity, cooling, backup power) and lifecycle or embodied emissions from the building materials, servers, batteries, and equipment manufacturing and replacements. Operational emissions are relatively straightforward to measure and are what most corporate GHG inventories focus on. Embodied emissions are another matter.
Operational energy metrics account for only about 30% of total emissions from the IT sector. The majority of the emissions are not directly from data centers or the energy they use, but from the end-user devices that access them, the emissions from manufacturing the hardware, and software inefficiencies.
This creates a significant measurement blind spot. Embodied and device emissions are reported as aggregate totals broken down by accounting category, such as capital goods and purchased goods, but not by product type. How much comes from end-user devices versus data center infrastructure, or employee laptops versus network equipment, remains murky, and therefore unoptimized.
The Embodied Carbon Problem in Hardware
Hardware manufacturing is where the numbers start to get uncomfortable. For facilities powered by very low-carbon electricity, embodied emissions from manufacturing become proportionally more significant. Research published in Cell Reports Sustainability found that when operational emissions are near-zero, hardware manufacturing can account for up to 40% of total lifecycle impact.
To understand why embodied carbon matters so much, consider the LCA data Devera has calculated for a laptop: a median footprint of 215.10 kg CO₂e, with a range of 157.88 to 286.70 kg CO₂e. The use phase contributes 38.3%, but raw materials extraction and component manufacturing together account for 61.2% of the total. A single laptop carries the same embodied carbon as driving a mid-sized car roughly 900 kilometres before a user ever switches it on. Now scale that to the tens of thousands of servers, networking cards, GPUs, and storage arrays inside a hyperscale data center, each replaced on a three-to-five-year cycle, and the size of the manufacturing emission inventory becomes clear.
Most cloud providers neither share nor consider server lifetimes in their public reporting. Servers typically get replaced every three to five years (longer for local data centers), leading to spikes in embodied emissions that are rarely captured in operational carbon accounts.
The same logic applies even further up the stack. Recent statistics show that large language models have significantly higher training emissions, including 588 tons of CO₂e for GPT-3, 5,184 tons for GPT-4, and 8,930 tons for Llama 3.1 (405B). Those figures do not include the embodied carbon of the GPUs used to run those training runs, which compounds the total considerably.
Operational Emissions: Grid Carbon Intensity Is Everything
On the operational side, the carbon intensity of the local electricity grid is the single most influential variable. Data centers are estimated to contribute around 0.5% of global CO₂ emissions today, but these emissions can vary significantly depending on location, as the carbon emission intensity of electricity differs by region.
The USA accounts for the highest share of global data center electricity consumption, responsible for 45% of global usage in 2024, followed by China at 25% and Europe at 15%. A data center running entirely on coal-dominated grid electricity in one part of the world can carry five to ten times the carbon intensity of a facility using the same hardware but drawing from a renewables-heavy grid.
A recent study examining 2,132 data centers operating across the United States between September 2023 and August 2024 found that these facilities accounted for over 4% of total US electricity consumption, with more than half of that electricity sourced from fossil fuels.
The IEA estimates that data center emissions will reach 1% of global CO₂ emissions by 2030 in its central scenario, or 1.4% in a faster-growth scenario. It notes that this is one of the few sectors where absolute emissions are set to grow, alongside road transport and aviation, as most of the economy will likely decarbonize.
Applying LCA Methodology to Data Center Carbon Footprints
The measurement gap described above is precisely why life cycle assessment has become the gold-standard methodology for anyone serious about understanding a data center’s total environmental impact. ISO 14040/44 provides the framework for conducting a credible LCA, defining system boundaries, data quality requirements, and interpretation rules across all lifecycle phases.
Google Cloud has developed an LCA approach to evaluate the embodied carbon emissions associated with the supply chain of its data center hardware, including AI/ML accelerators, compute machines, storage platforms, and networking equipment, consistent with global LCA standards ISO 14040/14044. Similarly, AWS defines operational emissions as direct Scope 1 and electricity-related Scope 2 emissions, while embodied emissions (Scope 3) represent indirect carbon across the value chain of cloud services, such as the manufacturing of servers, storage devices, networking equipment, and other hardware. These embodied emissions are measured using life cycle assessment, calculated as CO₂e across manufacturing, assembly, use, and end-of-life disposal, as defined in ISO 14040, ISO 14044, and the GHG Protocol Product Life Cycle Standard.
What makes a full LCA so valuable here is the phase breakdown. Without it, a sustainability team might optimize aggressively for PUE (the ratio of total facility energy to IT equipment energy) while missing the much larger signal buried in hardware procurement and replacement cycles.
LCAs can help operators make more informed choices during the scoping and purchasing process, as well as providing the metrics that contribute to the measurement of energy consumption across a data center’s productive lifetime. The convergence of net zero ambitions, regulatory pressure, ESG reporting requirements, and market drivers has made embodied carbon reporting a baseline expectation rather than an optional exercise.
For a practical illustration of how phase attribution changes decision-making: consider the Devera benchmark for a car tire, which records a median of 41.41 kg CO₂e with 65.0% of impact in raw materials and only 6.2% in transport. The implication is that a manufacturer focusing primarily on logistics optimisation would be improving a minor share of the problem while ignoring the dominant driver. The same logic applies to data center operators who invest heavily in renewable energy certificates for operational electricity but do not account for the raw materials and manufacturing carbon locked into their server fleet.
System Boundaries and What to Include
Defining system boundaries is the first critical decision in any data center LCA. A cradle-to-grave analysis under ISO 14067 would cover all of the following:
| Lifecycle Phase | Typical Emission Sources | GHG Protocol Scope |
|---|---|---|
| Hardware manufacturing | Chip fabrication, PCBs, rare earth extraction, server assembly | Scope 3 (capital goods) |
| Facility construction | Structural steel, concrete, cooling infrastructure | Scope 3 (capital goods) |
| Operational energy | Grid electricity for servers and cooling systems | Scope 2 (market or location-based) |
| Backup power | Diesel generators, on-site fuel combustion | Scope 1 |
| Refrigerants | Cooling system leakage (HFCs) | Scope 1 |
| Hardware end-of-life | E-waste processing, landfill, recycling | Scope 3 (end-of-life treatment) |
The key metrics for measuring data center sustainability include Power Usage Effectiveness (PUE), Water Usage Effectiveness (WUE), and Carbon Usage Effectiveness (CUE). PUE measures how efficiently a data center uses energy, WUE tracks water consumption, and CUE assesses the carbon emissions associated with data center operations. Each of these captures a different slice of the full picture, but none alone is sufficient for a complete LCA.
The AI Factor: Why the Data Center Carbon Footprint Is Accelerating
It is impossible to discuss data center carbon emissions in 2026 without addressing the AI acceleration. The IEA describes AI as “the most important driver” of data center electricity demand growth. As it stands, AI has been responsible for around 5-15% of data center power use in recent years, but this could increase to 35-50% by 2030.
The carbon footprint of AI systems alone could be between 32.6 and 79.7 million tons of CO₂ emissions in 2025. Those figures come with significant uncertainty ranges, precisely because disclosure from data center operators remains inconsistent and incomplete.
A Goldman Sachs Research analysis forecasts that about 60% of the increasing electricity demands from data centers will be met by burning fossil fuels, increasing global carbon emissions by about 220 million tons. For sustainability teams at brands and manufacturers who are Scope 3 reporters, this is a direct concern: cloud computing services fall squarely within purchased goods and services categories under the GHG Protocol, and their emissions trajectory is moving in the wrong direction.
Hyperscalers’ net-zero pledges are increasingly diverging from disclosed emissions: Google, Microsoft, and Meta have all reported emissions spikes in recent years despite corporate renewable energy purchasing, because growth is outpacing clean energy procurement.
Compliance and Reporting Obligations for Sustainability Teams
For brands and manufacturers under the EU regulatory orbit, the data center carbon footprint is not a voluntary consideration. Under CSRD, Scope 3 reporting is mandatory for all in-scope companies where value chain emissions are material. This is governed by ESRS E1 on climate change, which requires companies to disclose indirect emissions across both upstream and downstream activities.
Cloud services and data center usage sit within Scope 3 Category 1 (purchased goods and services) or Category 2 (capital goods), depending on whether the company uses managed services or owns its own infrastructure. Under the CSRD and the VSME framework, digital energy use should be disclosed as part of Scope 2 or Scope 3 greenhouse gas emissions, depending on whether a company operates or outsources its infrastructure.
The practical implication: a fashion brand running its e-commerce platform on a cloud provider, or a cosmetics manufacturer using cloud-based PLM software, has material Scope 3 exposure from data center operations. Scope 3 typically accounts for 70-90% of a company’s total carbon footprint, and digital infrastructure is a growing slice of that. To learn more about how brands are approaching the challenge of measuring and disclosing their full carbon inventory, the pressure to move from high-level estimates to product-level precision is accelerating across sectors.
While data center averages may be useful starting points for assessing environmental impact, there remains a clear need for more granular disclosure. This is precisely where product-level LCA tools, rather than spend-based approximations, begin to deliver materially better data quality for CSRD auditors.
Practical Strategies for Reducing Data Center Carbon Emissions
Understanding the full footprint through LCA is the prerequisite to reducing it. Once phase attribution is clear, the levers become more obvious.
Operational energy: The most direct path to reducing operational emissions is grid decarbonization. Renewable energy sources like solar, wind, and hydropower are cleaner alternatives to fossil-fuel-dependent grids. When secured via a power purchase agreement (PPA), these also provide long-term cost stability by shielding data centers from volatile fossil-fuel prices.
Improving PUE is valuable but should not be treated as the primary decarbonization lever. PUE is calculated as the ratio of total facility energy to IT equipment energy. A lower PUE means more efficient energy use. Most data centers operate around 1.55; energy-optimized facilities aim for a PUE below 1.2. The ceiling for PUE improvements is finite, while grid decarbonization and embodied carbon reduction have much larger remaining potential.
Embodied carbon in hardware: Circular economy practices, including equipment reuse, repair, and recycling to extend hardware lifecycles, reduce e-waste and the embodied carbon generated by replacement cycles. Extending server lifetimes by even one additional year can reduce the annualized embodied carbon per unit of compute by 20% or more.
Location and timing: Hosting AI workloads in regions with high renewable energy penetration lowers carbon intensity. Software systems can also be designed to adjust workloads based on real-time carbon intensity, running tasks when cleaner electricity is available.
Vendor selection and procurement: For companies that do not own their data center infrastructure, cloud provider selection is itself a material sustainability decision. Key criteria when evaluating providers include whether they use 100% renewable energy, hold ISO 14001 certification, provide carbon-neutral or carbon-negative services, and publish sustainability reports with disclosed emissions data.
To understand how automated LCA tools are changing the speed and quality of this kind of supplier-level carbon analysis, the full LCA software comparison for 2026 covers the methodology differences between major platforms.
Frequently Asked Questions
What is a data center carbon footprint and what does it include? A data center carbon footprint is the total greenhouse gas emissions, measured in CO₂-equivalent, generated across the full lifecycle of a data center. This includes operational emissions from electricity consumption and cooling, embodied emissions from hardware manufacturing and facility construction, Scope 1 emissions from on-site fuel combustion and refrigerant leakage, and end-of-life emissions from equipment disposal. A complete assessment follows ISO 14040/44 methodology and covers all three GHG Protocol scopes.
How do AI workloads change the carbon emissions profile of a data center? AI workloads are far more energy-intensive than standard computing tasks, requiring high-performance GPUs that draw significantly more power per server rack. Beyond operational electricity, AI accelerators have higher embodied carbon per unit due to the complexity of chip fabrication processes. Research published in peer-reviewed journals estimates that AI systems alone could generate between 32.6 and 79.7 million tonnes of CO₂e in 2025, with significant uncertainty depending on grid carbon intensity and hardware manufacturing disclosure rates.
How does CSRD require companies to report data center and cloud computing emissions? Under CSRD’s ESRS E1 standard, in-scope companies must disclose Scope 3 emissions across all material categories of their value chain. Cloud computing and data center services typically fall under GHG Protocol Category 1 (purchased goods and services) or Category 2 (capital goods). This means both the operational energy footprint of cloud usage and the embodied carbon of any owned IT infrastructure must be quantified and reported with auditable methodology documentation. Scope 3 GHG disclosure requirements have been preserved even under the revised Omnibus-simplified ESRS framework.
What methodology should sustainability teams use to calculate their data center carbon emissions? The most credible and audit-ready approach follows ISO 14040/44 for life cycle assessment, combined with ISO 14067 for product-level carbon footprint quantification. This requires defining a clear system boundary (typically cradle-to-grave for owned infrastructure, or cradle-to-gate for cloud services), selecting appropriate emission factors from databases such as Ecoinvent or DEFRA, and applying a consistent allocation method across hardware shared by multiple services or tenants. Activity-based data, such as actual energy consumption and server utilization rates, is preferred over spend-based approximations for CSRD assurance purposes.
For sustainability teams who need defensible, auditable numbers rather than spend-based approximations, calculate your product carbon footprint using ISO 14040/44 methodology mapped directly to your bill of materials. Devera brings product-level LCA coverage across your entire portfolio, with emission factors from Ecoinvent and DEFRA, and outputs structured for CSRD and GHG Protocol disclosure. If you’re evaluating whether the platform fits your reporting needs, see pricing for your portfolio size.