
Freight Transport Carbon Emissions: A Complete 2026 Guide
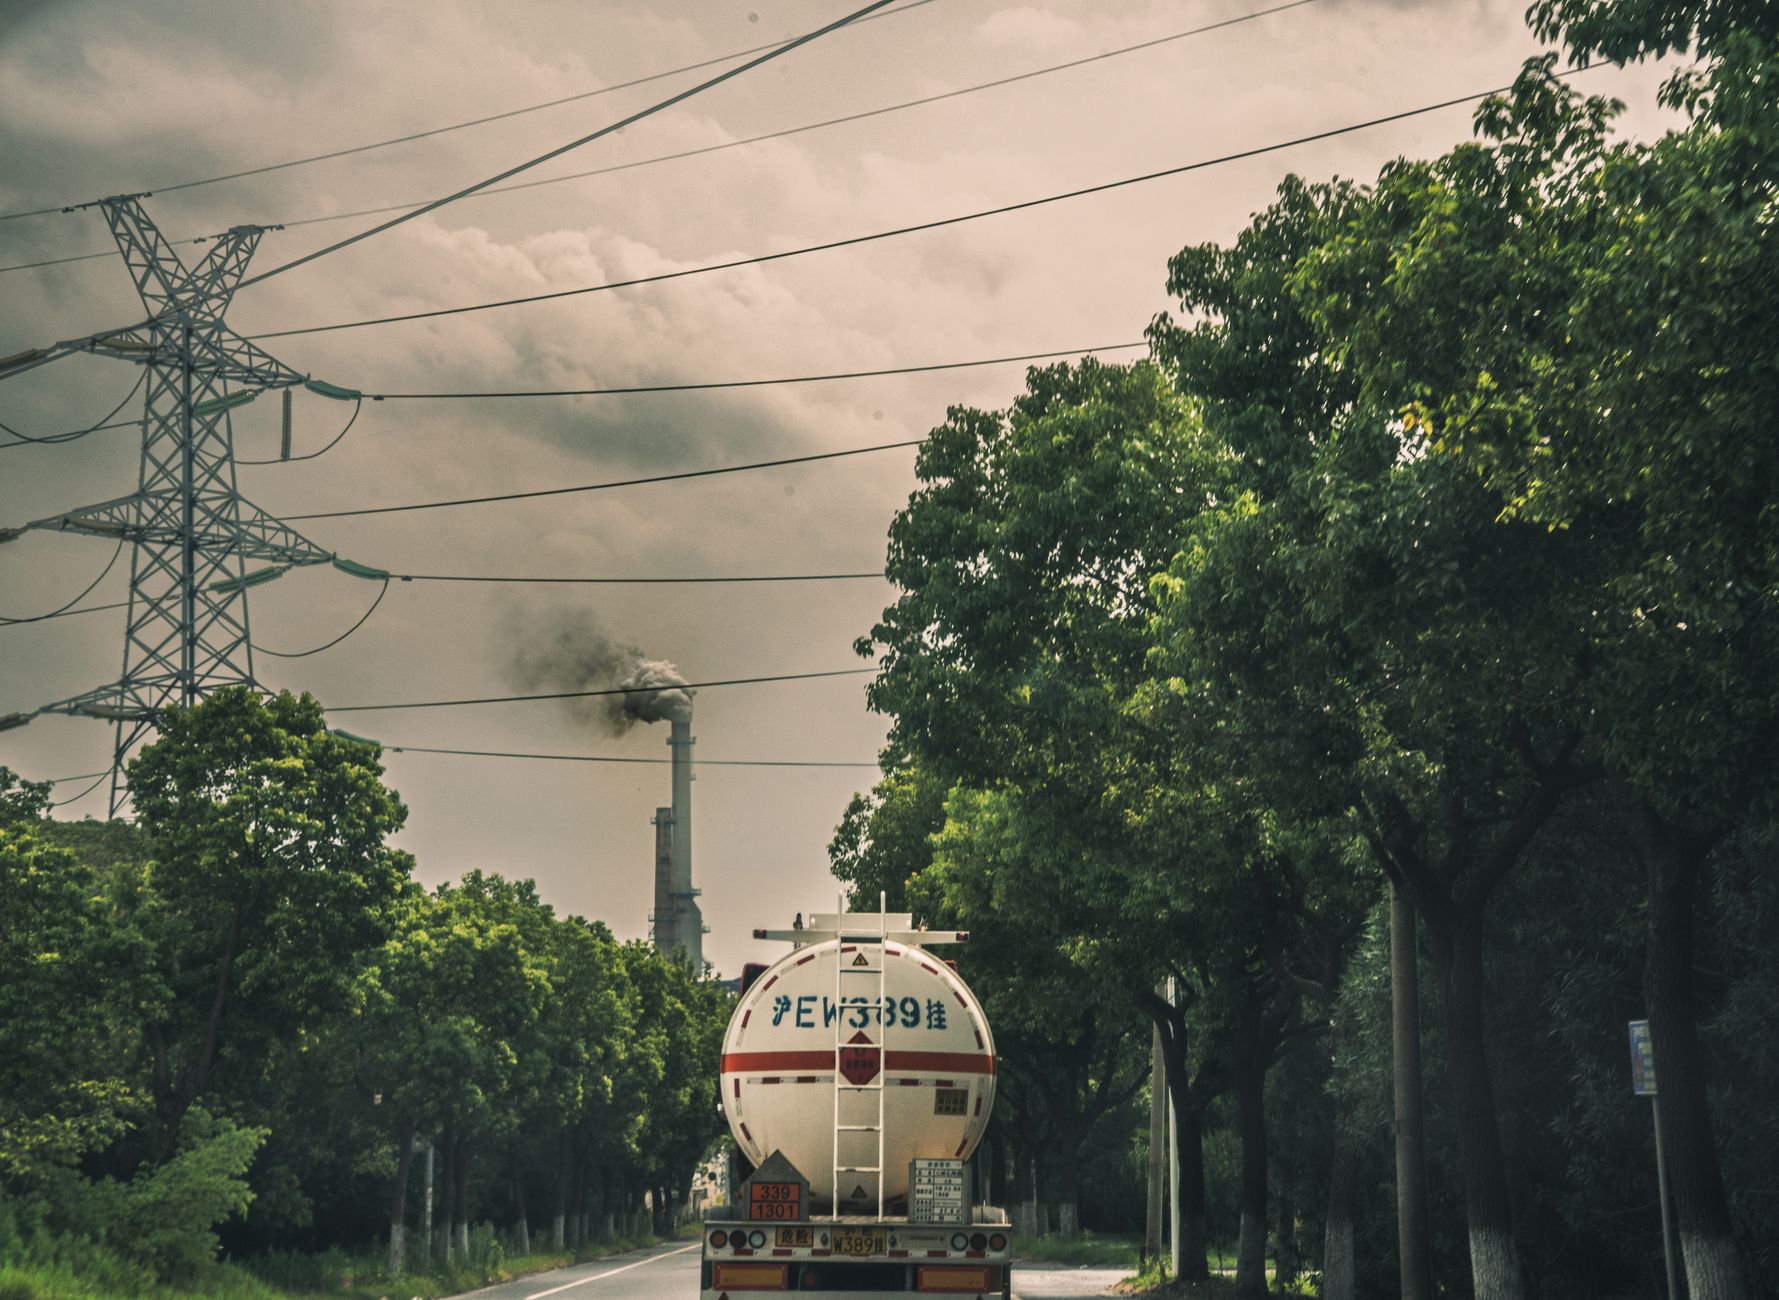
Photo by [女子 正真](https://www.pexels.com/photo/industrial-landscape-with-smokestack-and-tanker-33665234/) on Pexels
AI-generated article. Figures and regulatory references link to primary sources.
Freight transport carbon emissions are one of the fastest-growing and hardest-to-decarbonize sources of greenhouse gases in the global economy. Global merchandise trade generates around 3.2 gigatonnes of direct CO₂ from freight transportation every year, representing over 40% of all transport CO₂ emissions and roughly 10% of global CO₂ emissions. For sustainability and LCA teams at brands and manufacturers, this is not an abstract macro-statistic. It shows up directly in product carbon footprints, Scope 3 inventories, and increasingly in legal reporting obligations. This guide covers how freight emissions are structured, how they are measured under current standards, where they tend to hide in product lifecycles, and what brands need to do to report them credibly.
Key Takeaways
- Freight transport makes up 8% of global greenhouse gas emissions, and as much as 11% if warehouses and ports are included.
- Road transport constitutes the highest proportion of overall transport emissions. In 2023, it emitted 73% of all EU transport GHG emissions.
- Transport’s share in a product’s carbon footprint varies dramatically by category: for fresh apples it can reach 21%, while for a wine bottle it sits at just 5.5%.
- ISO 14083 is the global standard for quantifying and reporting GHG emissions from freight and passenger transport chains, first introduced in 2023 to standardize how companies calculate transport emissions.
- Under CSRD, Scope 3 reporting is mandatory for all in-scope companies where value chain emissions are material, governed by ESRS E1 on climate change.
Why Freight Is the Emissions Category Nobody Fully Accounts For
Most corporate sustainability teams have reasonably good visibility over their own operations: the fuel burned in their facilities, the electricity consumed in their offices and warehouses. Scope 1 and Scope 2 numbers are relatively controllable and well-understood. Freight is a different matter entirely.
Often, freight transport emissions are excluded or only partially included in emissions footprint calculations. This is partly a data problem and partly a methodological one. Supply chains are long and multimodal. A single shipment might move by truck to a port, by container vessel across an ocean, and by road again to a distribution centre. Each leg belongs to a different operator and uses different emission factors. Without a standardized methodology, comparing or aggregating those numbers is unreliable.
The scale of this oversight matters. Growing economies in Asia, Africa and Latin America are expected to triple global demand for freight by 2050. Without a systematic approach to accounting for freight emissions at the product level, brands will find themselves unable to meet the disclosure requirements already on the regulatory calendar.
The Road Transport Dominance Problem
When sustainability teams think about freight, they often focus on the most dramatic modes: intercontinental shipping, air freight. But the data consistently points somewhere else.
Transport accounts for about a third of all EU greenhouse gas emissions in 2023, and road transport is the largest contributor, responsible for almost 73% of transport greenhouse gas emissions. In the EU specifically, around 749 million tonnes of carbon dioxide were emitted from road transport fuel combustion in 2023. Of that, passenger cars and motorcycles accounted for the largest share at 61%, while heavy duty trucks and buses accounted for 27% and light duty trucks a further 12%.
The implication for product manufacturers is direct: the last-mile and mid-range distribution legs of most supply chains, which are overwhelmingly road-based, tend to carry the highest emission intensity per tonne-kilometre. Road freight comprises an outsized share of global freight CO₂ emissions and is also less cost-efficient per tonne-kilometre than rail or waterway. Yet it remains the default because it is the most flexible.
The transport sector is the largest source of greenhouse gas emissions in the European Union and has shown little progress in emission reduction in recent decades. Despite efforts such as increasing the deployment of electric vehicles and promoting low-carbon fuels, transport emissions have only declined slightly since 2005. This structural inertia makes it critical for brands to measure their transport-related footprint today rather than assume technological improvement will resolve the problem on their behalf.
What Transport Actually Contributes at the Product Level
Here is where the picture becomes counterintuitive, and where product-level LCA data tells a more nuanced story than macro statistics.
Many manufacturers assume that transport is a minor rounding error in their product’s lifecycle emissions. Raw materials, manufacturing energy, and packaging tend to get all the attention. But Devera’s ISO 14040/44 benchmark data shows that the contribution of transport depends heavily on product category, with some revealing surprises.
Take fresh apples. According to Devera’s benchmark for 1 kg of fresh apples, the median carbon footprint is 1.11 kg CO₂e, ranging from 0.78 to 1.67 kg CO₂e. Transport accounts for 21.3% of total lifecycle impact, one of the three dominant phases alongside raw materials (41.5%) and end-of-life. For a product with no energy-intensive manufacturing step and relatively light packaging, freight emissions are not a footnote: they are a structural driver. A food brand sourcing apples from a distant growing region and distributing them across multiple markets could find that optimizing the transport leg is one of the highest-leverage decarbonization levers available.
Now contrast that with wine. Devera’s benchmark for a 750ml wine bottle puts the median footprint at 1.89 kg CO₂e. Here, transport contributes just 5.5% of lifecycle emissions, while raw materials and manufacturing together account for over 91%. The wine bottle weighs more and travels by sea in bulk at high load factors, which drastically reduces transport’s relative share. A procurement or logistics team optimizing the wine supply chain for carbon would save very little by changing the shipping route. The real opportunity is upstream.
The contrast between these two products captures the central insight for any brand doing product carbon footprinting: transport’s relative weight in a lifecycle cannot be assumed. It must be calculated. The essential guide to calculating product carbon footprint covers how to structure that calculation across lifecycle phases.
There is one more instructive data point: bricks. Devera’s benchmark for 1 kg of brick shows a median footprint of 0.98 kg CO₂e, with transport responsible for 26.2% of lifecycle emissions, a remarkably high share for what appears to be a simple industrial product. The reason is the weight-to-value ratio: bricks are heavy and cheap, so freight costs (and freight emissions) represent a large fraction of total impact. Construction materials manufacturers in particular should treat transport as a primary, not secondary, decarbonization target.
The Measurement Standards You Need to Know
Credible freight emissions accounting is increasingly regulated by specific methodological standards. For product-level footprinting, ISO 14067 provides the framework for calculating product carbon footprints in line with ISO 14040/44, and transport emissions are a mandatory inclusion in a well-scoped cradle-to-grave PCF.
For transport-chain-level accounting specifically, the relevant standard is ISO 14083. ISO 14083 is a global standard for the quantification and reporting of GHG emissions arising from the operation of transport chains of passengers and freight. It is the first universal method for logistics emissions accounting, replacing EN 16258, and unlike its predecessor it introduces well-to-tank emissions into the calculation and allows companies to choose their own emissions factors, provided the source is credible.
The standard works by breaking transport chains into discrete segments. It breaks the transport chain into components known as Transport Chain Elements (TCEs), each associated with a specific transport or hub operation, further categorized into a Transport Operation Category (TOC) or a Hub Operation Category (HOC). This structure allows a company to account for a complex multimodal shipment systematically, with each leg calculated separately and rolled up into a total chain emission.
CountEmissionsEU is a new EU-wide regulation agreed at European Council and Parliament level in November 2025 that establishes a single calculation method for GHG emissions from passenger and freight transport. Its goal is to make emissions data more consistent and comparable across the EU, and it is built on ISO 14083 standards. For brands operating European supply chains, alignment with ISO 14083 is fast becoming a baseline requirement rather than a best practice.
The GLEC Framework as Practical Implementation
Where ISO 14083 sets out the technical requirements and principles, the GLEC Framework translates these into accessible, actionable guidance, making it easier for companies to implement compliant emissions calculations. For most product manufacturers who are not logistics operators themselves, the GLEC Framework provides the default emission factors needed to model transport legs when primary supplier data is unavailable.
CSRD and Freight: What Reporting Teams Must Disclose
The regulatory lens sharpens the urgency. CSRD’s Scope 3 reporting requirements follow the GHG Protocol’s framework, which divides value chain emissions into 15 categories across upstream and downstream activities. Both Category 4 (upstream transportation and distribution) and Category 9 (downstream transportation and distribution) are relevant for most product manufacturers.
Under CSRD, Scope 3 reporting is mandatory for all in-scope companies where value chain emissions are material, governed by ESRS E1 on climate change. This is a material departure from earlier frameworks: unlike previous frameworks such as TCFD, which only recommended Scope 3 disclosure, CSRD makes it a legal obligation.
The practical challenge is data quality. Clients increasingly require verified emissions data per shipment or per tonne-kilometre to meet their own CSRD Scope 3 reporting obligations. This creates a cascading demand signal through supply chains: a brand that cannot produce defensible transport emission figures will face questions from its customers, its auditors, and eventually its regulators.
Scope 3 emissions from subcontracted transport are typically one of the largest emission categories for logistics companies. ESRS expects companies to use the best available data, starting with primary data from subcontractors where possible and falling back to industry-average emission factors where it is not. For brands rather than logistics operators, the same principle applies when engaging freight carriers: push for primary activity data (actual fuel consumption, load factors, route distances) rather than generic average factors.
For a broader view of how Scope 3 categories interact with product sustainability, see Devera’s guide on life cycle assessment methodology.
How to Build a Defensible Transport Emissions Figure for Your Product
For LCA and sustainability practitioners at manufacturing brands, the methodology question is practical. How do you actually arrive at a credible number for the transport phase of your product footprint?
The starting point is defining system boundaries clearly. A cradle-to-gate PCF will include upstream transport (raw materials to factory gate) but exclude distribution. A cradle-to-grave PCF must include all transport legs through to end-of-life. Most regulatory frameworks and EPD standards require the latter for consumer products.
Activity-based data is the gold standard. Activity-based methods use physical data such as tonnes of material purchased, kilometres of freight transport, and kilowatt-hours of energy consumed, combined with specific emission factors. Activity-based data is more accurate, more defensible under assurance, and more useful for identifying reduction opportunities.
Where primary data is unavailable, default emission factors from the GLEC Framework or national government datasets (such as DEFRA emission factors for UK-based reporting) provide a recognized fallback. The key is documentation: auditors and verifiers need to see both the emission factors used and their sources.
Finally, mode switching is often the highest-leverage reduction intervention for the transport phase. A single freight train with 40 railcars can replace 100 trucks, reducing CO₂ emissions and mitigating highway congestion. For brands with long domestic distribution routes, a shift from road to rail can materially reduce transport-phase emissions without any change to the product itself. That kind of insight only becomes visible when you have calculated the transport phase accurately in the first place.
For brands exploring how transport fits into a broader decarbonization strategy, the post on sustainable manufacturing provides useful context on integrating lifecycle thinking into production and supply chain decisions. And for those navigating the full range of product carbon footprint calculations, having transport as a properly modeled phase rather than a rough estimate makes a significant difference in both accuracy and auditability.
Frequently Asked Questions
What is ISO 14083 and why does it matter for freight emissions reporting? ISO 14083 is the international standard for quantifying and reporting greenhouse gas emissions from freight and passenger transport chains, published in March 2023. It establishes a consistent methodology applicable across all transport modes, including road, rail, sea, and air, and forms the basis of CountEmissionsEU, the EU’s new mandatory transport emissions framework. For brands, alignment with ISO 14083 ensures that transport-phase emissions included in a product carbon footprint are calculated using a recognized and auditable approach.
How much do freight transport carbon emissions typically contribute to a product’s lifecycle? The share varies considerably by product type and cannot be assumed. Devera’s ISO 14040/44 benchmark data shows transport accounting for 21.3% of the lifecycle footprint of fresh apples but only 5.5% for a 750ml wine bottle. Products with high weight-to-value ratios and long distribution distances tend to show the highest transport shares, while products with energy-intensive manufacturing typically show transport as a minor fraction.
Does CSRD require companies to report transport emissions specifically? Yes. Under CSRD and ESRS E1, in-scope companies must disclose Scope 3 emissions broken down by material category, and both upstream transportation (GHG Protocol Category 4) and downstream transportation (Category 9) are standard scope 3 categories that must be assessed for materiality. Companies that cannot produce defensible, methodology-supported figures for freight-related emissions risk non-compliance and third-party assurance failures.
What is the difference between well-to-wheel and tank-to-wheel emissions in freight accounting? Tank-to-wheel emissions cover only the direct combustion of fuel during vehicle operation. Well-to-wheel (or well-to-tank plus tank-to-wheel) adds the upstream emissions from producing and refining that fuel before it reaches the vehicle. ISO 14083 explicitly requires well-to-tank emissions to be included in transport chain calculations, which means any freight emission figure that uses only direct combustion factors will undercount the true climate impact of that transport leg.
For sustainability teams who need transport modeled as a real lifecycle phase rather than a rough estimate, Devera’s product carbon footprint platform applies ISO 14040/44 methodology across every leg of your supply chain, from raw material haulage to final distribution. If you are scoping what defensible Scope 3 transport data looks like for your portfolio, see how the pricing works.